Seattle Industrial & Warehouse Market Report | Q2 2026
Key Takeaways
- Puget Sound industrial vacancy was 9.4% in Q2 2026, down 20 basis points from 9.6% in Q1 (as restated) but still up 120 basis points from 8.2% a year earlier. Kidder Mathews and CBRE both recorded rising vacancy in Q2.
- Net absorption swung to +776,233 SF in Q2 from −337,835 SF in Q1. Cushman & Wakefield credits much of the gain to a 1.1 million SF owner/user transaction involving Amazon in Frederickson. Leasing volume fell to 1.5 million SF from about 2.1 million SF in Q1.
- Asking rents were flat. Kidder Mathews put the blended Puget Sound rate at $1.06/SF NNN per month (about $12.72/SF per year), roughly flat on the quarter and unchanged from a year earlier.
- The pipeline shrank to 1.8 million SF under construction from 2.3 million SF in Q1, and just 535,000 SF was delivered in the quarter. Large tenants mostly renewed in place, and most deals were 20,000 SF or smaller. Browse Seattle warehouse listings on WareCRE.
9.4%
Overall Vacancy (Q2 2026)
$1.06
Blended Asking Rent (NNN/SF/Mo)
+776K
SF Net Absorption (Q2)
1.8M
SF Under Construction
Seattle and the broader Puget Sound region form one of the West Coast’s most important industrial markets. It is a Pacific gateway anchored by the Northwest Seaport Alliance (the ports of Seattle and Tacoma) and hemmed in by water, mountains and tight land supply. On Cushman & Wakefield’s numbers, fundamentals stopped deteriorating in Q2 2026. Vacancy ticked down to 9.4% from a restated 9.6%, net absorption turned positive at 776,233 SF, and the pipeline contracted again to 1.8 million SF across a 269.6 million SF inventory base.
The improvement is narrow. Vacancy is still 120 basis points higher than a year ago, leasing volume fell quarter over quarter, and one owner/user deal accounted for much of the absorption. For businesses looking for warehouse space in Seattle, the market still favors tenants on large requirements, while small-bay space is where most of the deals and the competition are.
Market Snapshot: Q2 2026
| Metric | Q2 2026 | Context |
|---|---|---|
| Overall vacancy | 9.4% | ↓20 bps from 9.6% in Q1 as restated (published at 9.7%); ↑120 bps YoY from 8.2% |
| Blended asking rent | $1.06/SF NNN/mo | About $12.72/SF/yr; roughly flat QoQ, unchanged YoY (Kidder Mathews) |
| Net absorption (Q2) | +776,233 SF | Swing to positive from −337,835 SF in Q1 |
| Leasing activity (Q2) | 1.5M SF | ↓from about 2.1M SF in Q1 as restated (nearly 3.6M SF year to date); excludes renewals |
| Deliveries (Q2) | 535,000 SF | Across two projects; about 1.75M SF delivered year to date |
| Under construction | 1.8M SF | Down from 2.3M SF in Q1; supply pressure easing |
| Total inventory | 269.6M SF | Cushman & Wakefield basis; Kidder Mathews tracks 410.9M SF over a wider geography |
Vacancy levels differ by source because each tracks a different geography and inventory base. Cushman & Wakefield reports 9.4% and falling, while Kidder Mathews (9.5%) and CBRE (11.7%) both show vacancy rising. Cushman & Wakefield and Kidder Mathews agree on the level to within 0.1 point but disagree on the direction.
Rent Trends: $1.06/SF/mo, Unchanged From a Year Ago
Kidder Mathews put the blended Puget Sound asking rate at $1.06/SF NNN per month in Q2 2026, or about $12.72/SF per year. Pacific Northwest industrial space is quoted monthly on an NNN basis, so the monthly figure is the one used in negotiations. The rate was a cent below Q1 and unchanged from a year earlier. This page follows the Kidder Mathews series; Cushman & Wakefield’s narrower series puts the Q2 average at $1.04, up $0.06 from a year earlier.
With 9.4% vacancy, landlords are holding face rates and competing on concessions: free rent, improvement allowances and flexible terms. Cushman & Wakefield describes concession packages as aggressive and says landlords remain focused on tenant retention. The pressure is heaviest on big-box space, where demand for requirements over 200,000 SF remains well below historical norms.
For Tenants
Tenants hold the leverage, especially on requirements above 100,000 SF, where few users are active. Negotiate free rent, improvement allowances and term flexibility, since face rates are not moving. Requirements at or under 20,000 SF face a faster, more competitive process because most deals are that size. Search Seattle warehouse listings on WareCRE.
Construction Pipeline: Down to 1.8 Million SF
Puget Sound had 1.8 million SF under construction at the end of Q2 2026, down from 2.3 million SF in Q1. Deliveries slowed to 535,000 SF across two projects in the quarter, bringing the year-to-date total to about 1.75 million SF, per Cushman & Wakefield. Measured against a 269.6 million SF inventory base, the active pipeline is under 0.7% of standing stock, and Cushman & Wakefield expects development to stay subdued.
Most of the quarter’s positive absorption came from one deal. Cushman & Wakefield ties it largely to a 1.1 million SF owner/user transaction involving Amazon at the former Frederickson Ashley Distribution Center. Frederickson alone absorbed 1,110,154 SF, more than the market’s 776,233 SF net total. Speculative buildings delivered this year still added vacancy, but with the pipeline this thin and land this scarce, large-user demand will decide when the softness ends.
For Operators
Protect occupancy over rate. Absorption turned positive and the pipeline fell to 1.8 million SF, but leasing volume dropped from Q1 and most large tenants renewed in place, so the pool of tenants for large blocks remains shallow. UNFI’s lease closed after a 19-month marketing period, a fair benchmark for downtime on large vacant blocks today. Small-bay space, especially close in, remains the most active part of the market.
Submarket Breakdown: Auburn at 4.0% Vacancy, Kent and Sumner Above 10%
Kent
Kent is the region’s largest submarket at 48.9 million SF and the core of Kent Valley big-box distribution. Vacancy was 10.2% in Q2 2026, above the market average, reflecting its concentration of large available blocks. A big requirement will find more competing options here than anywhere else in Puget Sound.
South Seattle
South Seattle is the close-in infill core, nearest the Port of Seattle and the urban consumer base. Vacancy was 9.2%, and at $1.33/SF NNN per month it is the priciest of the four Cushman & Wakefield submarkets profiled here. Kidder Mathews puts the overlapping Seattle Close-In submarket at 9.9% vacancy and $1.37/SF NNN per month. Small users pay a premium here but have plenty of choice.
Sumner
Sumner is a Pierce County bulk-distribution submarket, asking $1.00/SF NNN per month with vacancy at 12.4%, the highest of the four. Absorption was still positive at 71,359 SF in Q2. In the adjacent Puyallup submarket, Serta-Simmons renewed 272,834 SF at IAC Port 167, the quarter’s largest lease.
Auburn
Auburn is the tightest major submarket at 4.0% vacancy, a landlord’s market inside an otherwise soft region. American Tire Distributors renewed 126,036 SF here in Q2. Tenants targeting Auburn should expect few alternatives and little negotiating room.
| Submarket | Vacancy (Q2 2026) | Asking Rent (Q2 2026, NNN/SF/Mo) | Q2 2026 Profile |
|---|---|---|---|
| Kent | 10.2% | $0.96 | Largest submarket (48.9M SF); core Valley big-box; lowest rent of the four |
| South Seattle | 9.2% | $1.33 | Close-in infill; priciest of the four |
| Sumner | 12.4% | $1.00 | Pierce County bulk; highest vacancy of the four |
| Auburn | 4.0% | $0.98 | Tightest major submarket |
Vacancy and asking rents above are Cushman & Wakefield Q2 2026 (overall weighted net asking rent, $/SF/mo). Across the Cushman & Wakefield Puget Sound submarkets, Q2 asking rents run from $0.62 in Lacey to $1.45 in North of Ship Canal to 205th. The Kidder Mathews view below uses different submarket definitions.
| Kidder Mathews Submarket | Vacancy (Q2 2026) | Asking Rent (Q2 2026, NNN/SF/Mo) |
|---|---|---|
| Eastside | 6.0% | $1.88 |
| Seattle Close-In | 9.9% | $1.37 |
| Southend | 10.4% | $1.05 |
| Pierce | 12.7% | $0.83 |
| Thurston | 5.8% | $0.76 |
The two tables use different submarket definitions and inventory bases (Kidder Mathews also covers the Eastside, the Northend, and Skagit and Whatcom counties, which the Cushman & Wakefield table omits), so read them as complementary views of the region.
Co-Warehousing & Flexible Warehouse Space in Seattle
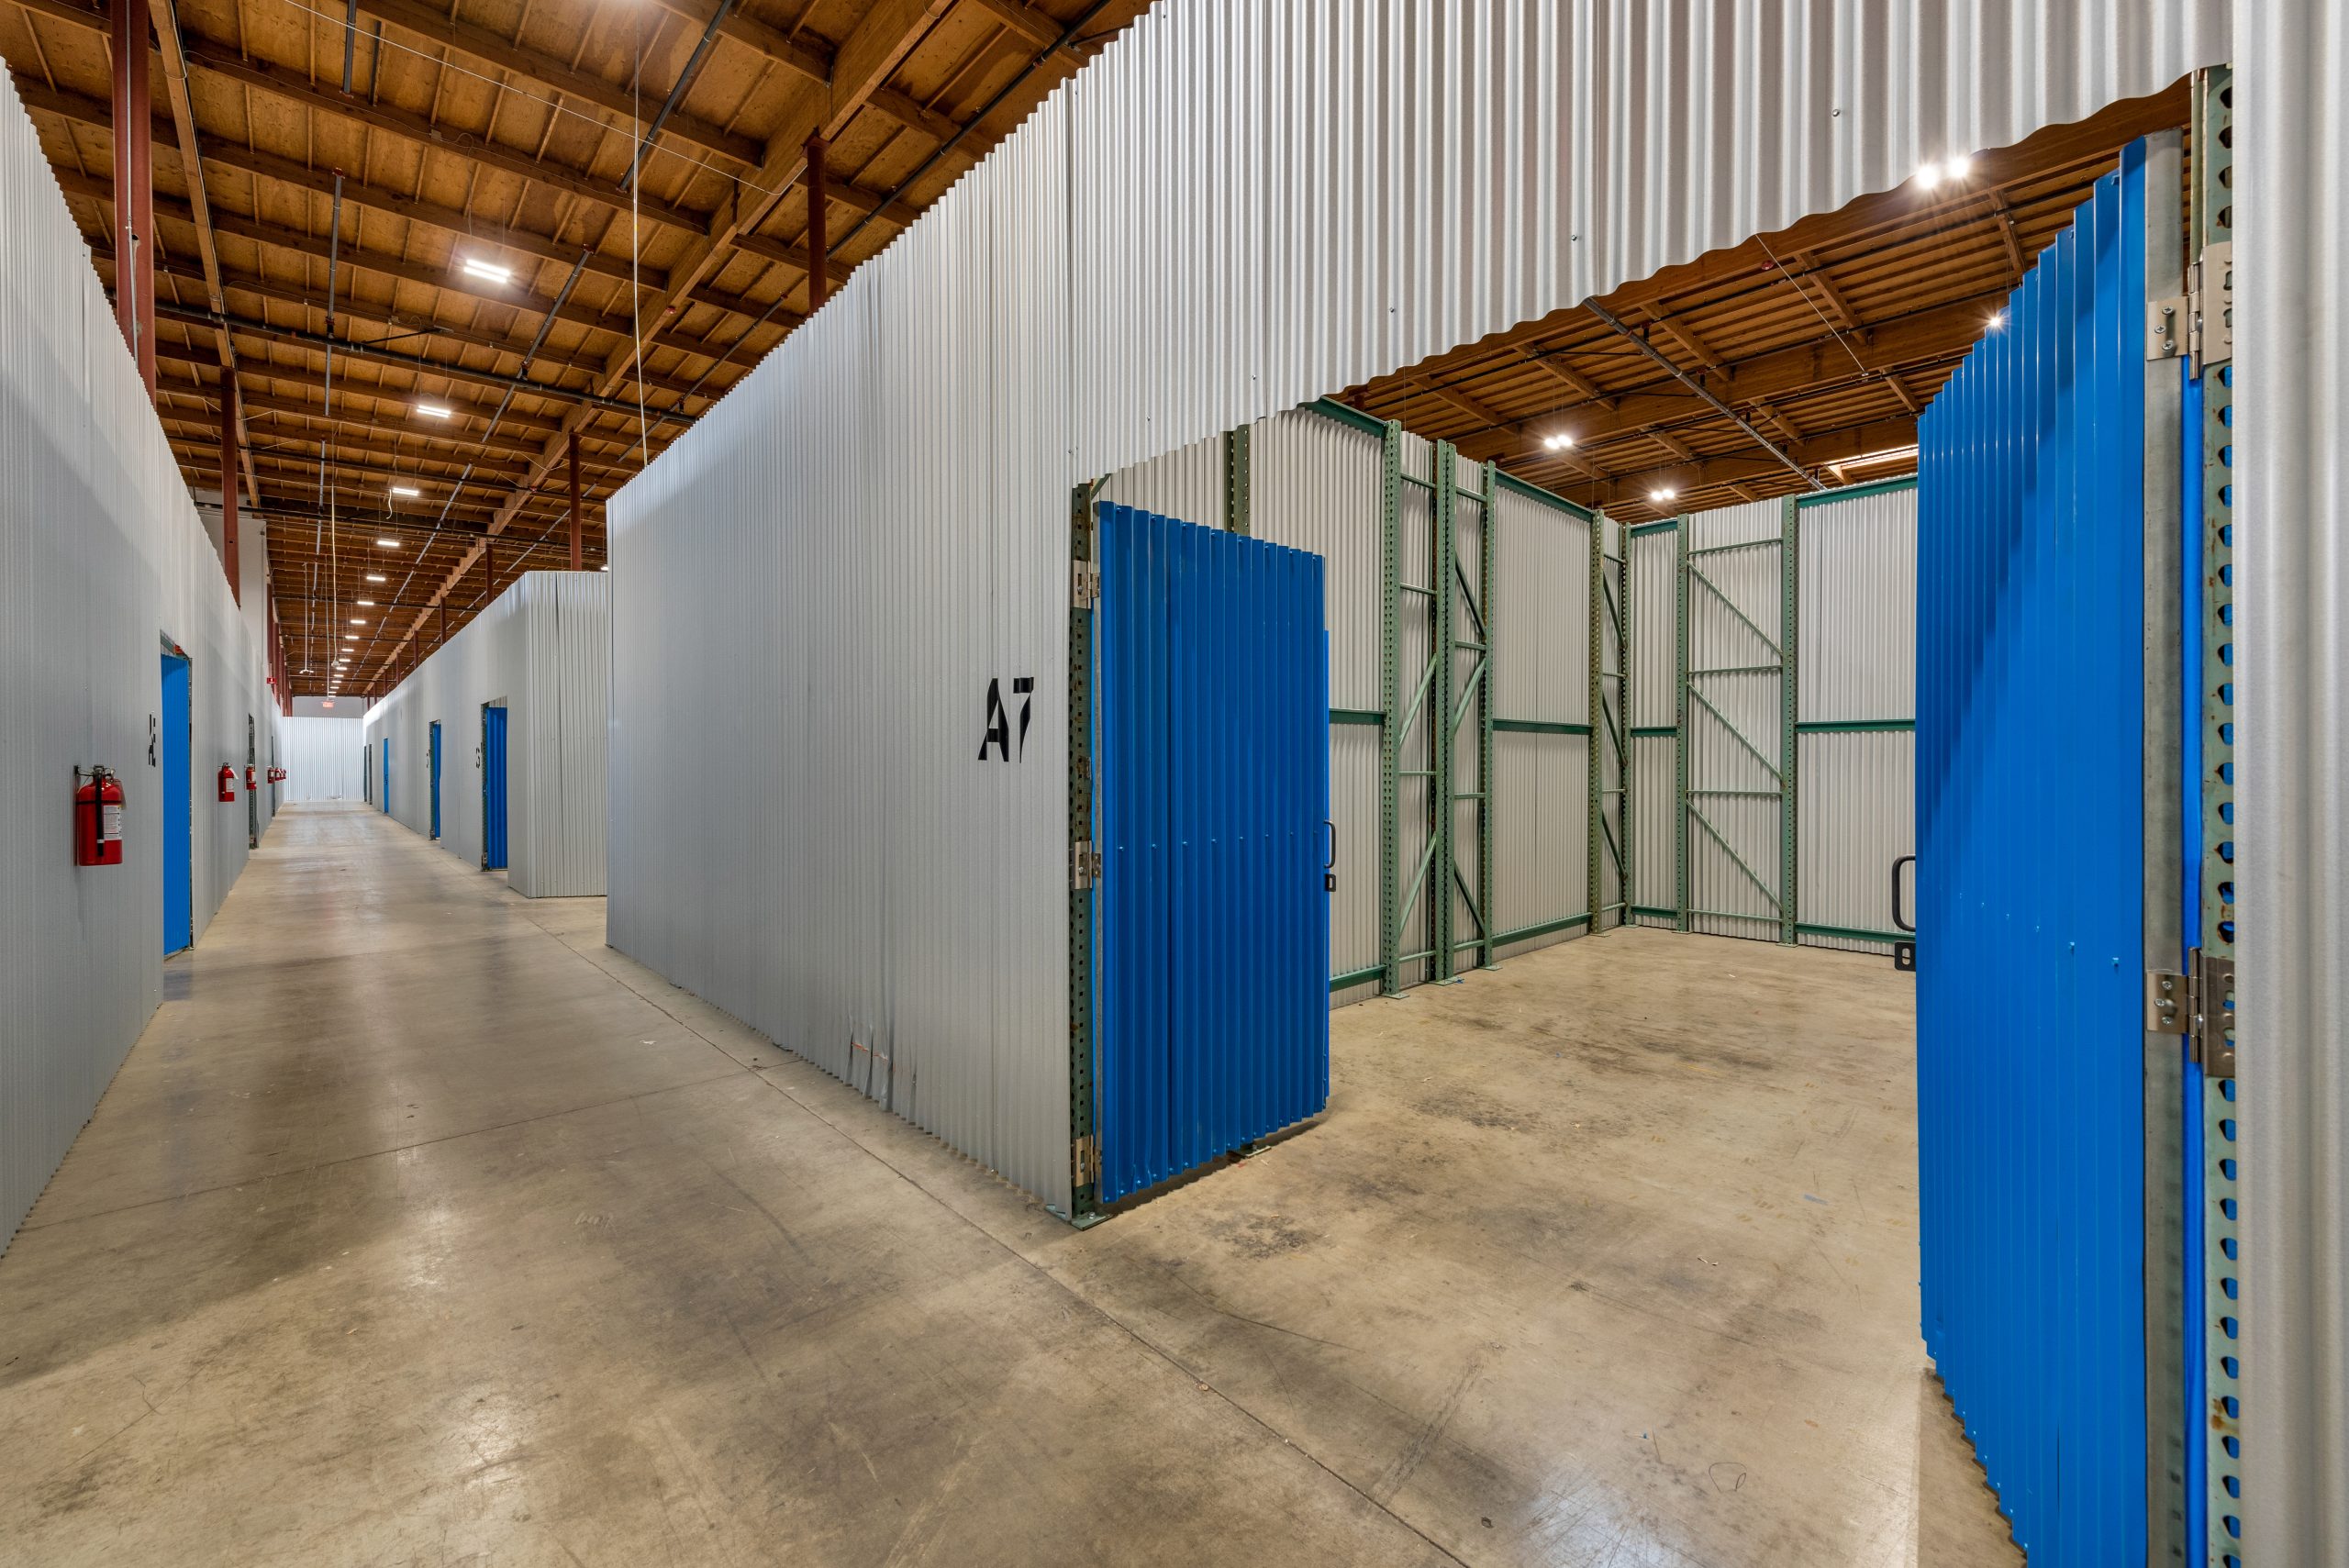
Small-bay deals make up most of the market’s transactions. Kidder Mathews reports median lease sizes of 2,537 to 6,450 SF across its Puget Sound submarkets, and in the Southend most Q2 activity was in spaces of 20,000 SF or less. Cushman & Wakefield saw growing activity among small- and mid-sized users in Q2. For an occupier under 20,000 SF, the market is functioning normally.
Close-in supply at that size is deep. Kidder Mathews counts 269 available spaces under 10,000 SF in Seattle Close-In, plus 73 in the 10,000 to 25,000 SF band, giving smaller users real choice inside the urban core at about $1.37/SF NNN per month.
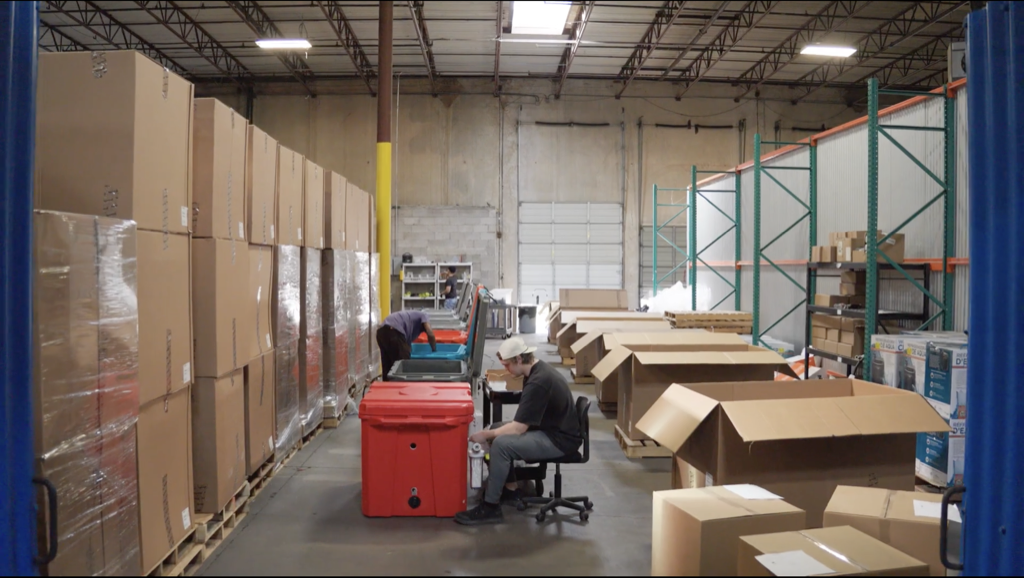
Flexible-space demand in Seattle comes mostly from last-mile and e-commerce operators that need to sit close to urban customers, and from contractors and building trades. Food and beverage makers, importers and 3PLs using the Northwest Seaport Alliance gateway, and growing businesses that want space without a long big-box lease make up the rest.
Browse available co-warehousing and small-bay warehouse listings on WareCRE’s Seattle marketplace.
Looking for warehouse space in Seattle?
Key Trends to Watch
1. Large Tenants Are Mostly Renewing in Place
Two of the quarter’s three largest leases were renewals. Serta-Simmons renewed 272,834 SF at IAC Port 167 in Puyallup and American Tire Distributors renewed 126,036 SF in Auburn, while UNFI signed for 135,975 SF after a 19-month marketing period. Cushman & Wakefield says many widely discussed big-box opportunities reverted to renewals rather than relocations, and it expects leasing to stay renewal-driven. Large-user demand remains well below historical norms.
2. Small-Bay and Big-Box Space Are Moving at Different Speeds
Median lease sizes run from 2,537 to 6,450 SF and most deals are 20,000 SF or smaller, yet UNFI’s 135,975 SF space sat on the market for 19 months. Small-bay and big-box space are behaving like separate markets. Vacancy splits just as sharply by submarket, from 4.0% in Auburn to 12.4% in Sumner among the four profiled above. For the national picture, see Small-Bay vs. Big-Box: What the Vacancy Gap Means in 2026.
3. A 1.8 Million SF Pipeline Leaves Little New Supply Ahead
This year’s speculative completions arrived vacant and still weigh on the market, but little product follows them. The pipeline is 1.8 million SF against 269.6 million SF of inventory, and deliveries slowed to 535,000 SF in the quarter. With chronic land scarcity and exposure to Pacific trade flows, the market could tighten quickly if large-user demand returns. For broader context, see Industrial Real Estate Trends & Outlook 2026 and, on trade policy, How Tariffs Are Reshaping Warehouse Demand in 2026.
Outlook: What to Watch in Q4 2026
Cushman & Wakefield’s Q2 numbers improved, while Kidder Mathews and CBRE both show vacancy still rising. Large-user demand, which has not recovered, will decide which reading holds.
Vacancy direction. Watch whether vacancy holds or edges lower through the back half of 2026. Cushman & Wakefield expects it to stay elevated through year-end. Only 1.8 million SF is under construction, but Q2’s positive absorption leaned on a single owner/user deal.
Rent direction. Watch whether rents stay flat. At $1.06/SF NNN per month blended, unchanged from a year earlier, and with 9.4% vacancy, face rates have little room to rise outside the tightest submarkets. For now, landlords compete through concessions.
Deal size. Kidder Mathews counted only two leases over 100,000 SF in Q2. A rising count alongside larger median lease sizes would show occupiers expanding again. Until then, tenants with large requirements hold the leverage, and the 19 months UNFI’s space spent on the market shows how long big blocks can sit.
Find warehouse space in Seattle
Browse co-warehousing, small-bay, and distribution listings across the Puget Sound region.
Data sources: Cushman & Wakefield Seattle MarketBeat Q2 2026 (vacancy, absorption, deliveries, construction, inventory, submarket vacancy), Kidder Mathews Seattle 2Q26, 1Q26 and 2Q25 (blended asking rent, submarket and lease-size data), CBRE Puget Sound Q2 2026, WareCRE marketplace data. The headline asking rent follows the Kidder Mathews series; vacancy, absorption, supply and the first submarket table follow Cushman & Wakefield. Source inventory bases differ (Cushman & Wakefield 269.6M SF, Kidder Mathews 410.9M SF), so figures are not directly interchangeable.
Related Resources
Frequently Asked Questions
What is the current industrial vacancy rate in Seattle?
Puget Sound industrial vacancy was 9.4% in Q2 2026 on the Cushman and Wakefield basis, down 20 basis points from 9.6% in Q1 as restated but up 120 basis points from 8.2% a year earlier. Kidder Mathews reports 9.5% and CBRE 11.7%, both rising, so Cushman and Wakefield and Kidder Mathews agree on the level but not the direction.
How much does warehouse space cost in Seattle?
Puget Sound industrial space is quoted monthly on an NNN basis. The blended asking rate was $1.06/SF per month in Q2 2026, about $12.72/SF per year, per Kidder Mathews. That is roughly flat on the quarter and unchanged from a year earlier. By Kidder Mathews submarket, Pierce was $0.83, Thurston $0.76, Southend $1.05, Seattle Close-In $1.37 and the Eastside $1.88 per SF per month.
Is Seattle a good market for warehouse tenants right now?
For large requirements, yes. Vacancy is still 120 basis points above year-ago levels, leasing volume fell from Q1, and large-user demand is well below historical norms, which supports negotiation on free rent, improvement allowances and term. Space at or under 20,000 SF is the exception. Most Q2 deals were that size, so smaller users should expect a faster, more competitive process.
Which Seattle submarket is best for warehouse space?
It depends on size and budget. Kent is the largest submarket at 48.9 million SF with the deepest big-box inventory and 10.2% vacancy. Of the four profiled here, Sumner is the loosest at 12.4% vacancy and Auburn the tightest at 4.0%. Kent asks the least of the four at $0.96/SF per month, while Lacey is the cheapest Cushman and Wakefield submarket overall at $0.62. South Seattle, the close-in infill option, has 9.2% vacancy and the highest rent of the four. Kidder Mathews counts 269 available spaces under 10,000 SF in the overlapping Seattle Close-In area.