New York City Industrial & Warehouse Market Report | Q1 2026
Key Takeaways
- The New York City metro remains the highest-priced, most supply-constrained industrial market in the country. Five-borough vacancy ticked up to about 7.5% in Q1 2026, with asking rents averaging $22.64/SF NNN and the Outer Boroughs reaching $28.59/SF — the priciest industrial space in the U.S.
- Northern New Jersey — the region’s logistics backbone — posted its third straight positive quarter, with about 3.7 million SF of net absorption and a surge in Class A leasing (JLL tracked roughly 13 million SF of total leasing).
- It’s a flight to quality. Creditworthy occupiers are prioritizing modern Class A space, pulling that segment’s vacancy down and holding rents firm, while older product is giving space back — a clear separation in both occupancy and rent.
- Tenant leverage is scarce in last-mile and Class A, but real in older Class B product and where new Northern NJ supply is delivering. Browse New York City warehouse listings on WareCRE.
7.5%
NYC Vacancy
$22.64
NYC Avg. Rent (NNN/SF)
+3.7M
N. NJ Net Absorption (Q1)
$28.59
Outer Boroughs Rent (highest in US)
The New York City metro — the five boroughs plus Northern New Jersey — is the largest consumer market in the country and, by extension, one of its most valuable industrial markets. Demand here is driven by sheer population: more than 20 million people who need to be served by last-mile and regional distribution, in a market where developable industrial land is extraordinarily scarce. The result is the highest industrial rents in the nation and a persistent structural shortage of close-in space.
Entering Q1 2026, the metro is bifurcating. Modern Class A space is in high demand and tightening, while older product is losing tenants — and the five-borough market has seen vacancy edge up as some new supply delivered. For businesses looking for warehouse space in New York City, success means understanding where the leverage actually is. Here’s the full Q1 2026 picture.
Market Snapshot: Q1 2026
| Metric | Q1 2026 | Context |
|---|---|---|
| NYC vacancy | ~7.5% | Availability ~9.2%; supply outpacing demand |
| NYC avg. asking rent | $22.64/SF NNN | ~−0.9% YoY; among highest in the U.S. |
| Outer Boroughs rent | $28.59/SF NNN | +8.6% YoY; highest-priced market tracked |
| N. NJ net absorption | +3.7M SF | Third straight positive quarter |
| N. NJ leasing | ~8.6–13M SF | Class A surge; first-time deals +28% vs trend |
| N. NJ net asking rent | ~$16.66/SF NNN | Class A firm; older product softening |
Rent Trends: The Nation’s Priciest, Now Bifurcating
New York remains the most expensive industrial market in the U.S. Five-borough rents average $22.64/SF NNN, and the Outer Boroughs — Brooklyn, Queens, and the Bronx — reached $28.59/SF, up 8.6% year-over-year and the highest of any market tracked. That premium reflects the basic math of last-mile: serving 20 million consumers from a shrinking pool of close-in industrial space.
Beneath the headline, the market is splitting. Modern Class A space is holding rents firm as creditworthy occupiers compete for it, while older Class B/C product is softening and giving rent back. Five-borough rent growth slipped slightly negative (~−0.9%) as some new supply delivered, but the quality segment remains landlord-favorable. In Northern NJ, the net asking rate sits near $16.66/SF, with the same Class A versus older-product separation.
For Tenants
Leverage is uneven. Last-mile space in the Outer Boroughs is scarce and getting more expensive — expect to pay up and move fast. Older Class B product and select Northern NJ submarkets digesting new supply offer more room to negotiate. If you can use functional older space rather than trophy Class A, this is where the value is in the NYC metro. Search New York City warehouse listings on WareCRE.
Construction Pipeline: Concentrated in New Jersey
Industrial development in the NYC metro is overwhelmingly concentrated in Northern New Jersey, where land availability and infrastructure can still support large-format projects — the five boroughs simply lack developable sites at scale. That new Class A supply is being absorbed well by quality-seeking occupiers (three straight quarters of positive Northern NJ absorption), even as it adds availability that older buildings struggle to compete with.
The structural takeaway hasn’t changed: New York can’t build its way out of its land scarcity. New supply helps at the margin in New Jersey, but the close-in, last-mile shortage that defines the market — and underpins its record rents — is a long-term feature, not a cyclical one.
For Operators
Quality wins this cycle. Modern Class A and well-located last-mile assets are holding rate and occupancy as occupiers consolidate into the best space; the Outer Boroughs continue to set national rent records. Owners of older product face real competition and should weigh repositioning against rate. Northern NJ Class A fundamentals remain strong on three straight quarters of positive absorption.
Submarket Breakdown
NYC Outer Boroughs (Brooklyn, Queens, Bronx)
The last-mile heart of the metro and the most expensive industrial space in the country at about $28.59/SF NNN, up 8.6% year-over-year. Extreme land scarcity and relentless demand to serve the urban consumer keep this segment tight and pricey. Multi-story and infill product are increasingly the only way to add supply. Rents: ~$25–$35/SF NNN.
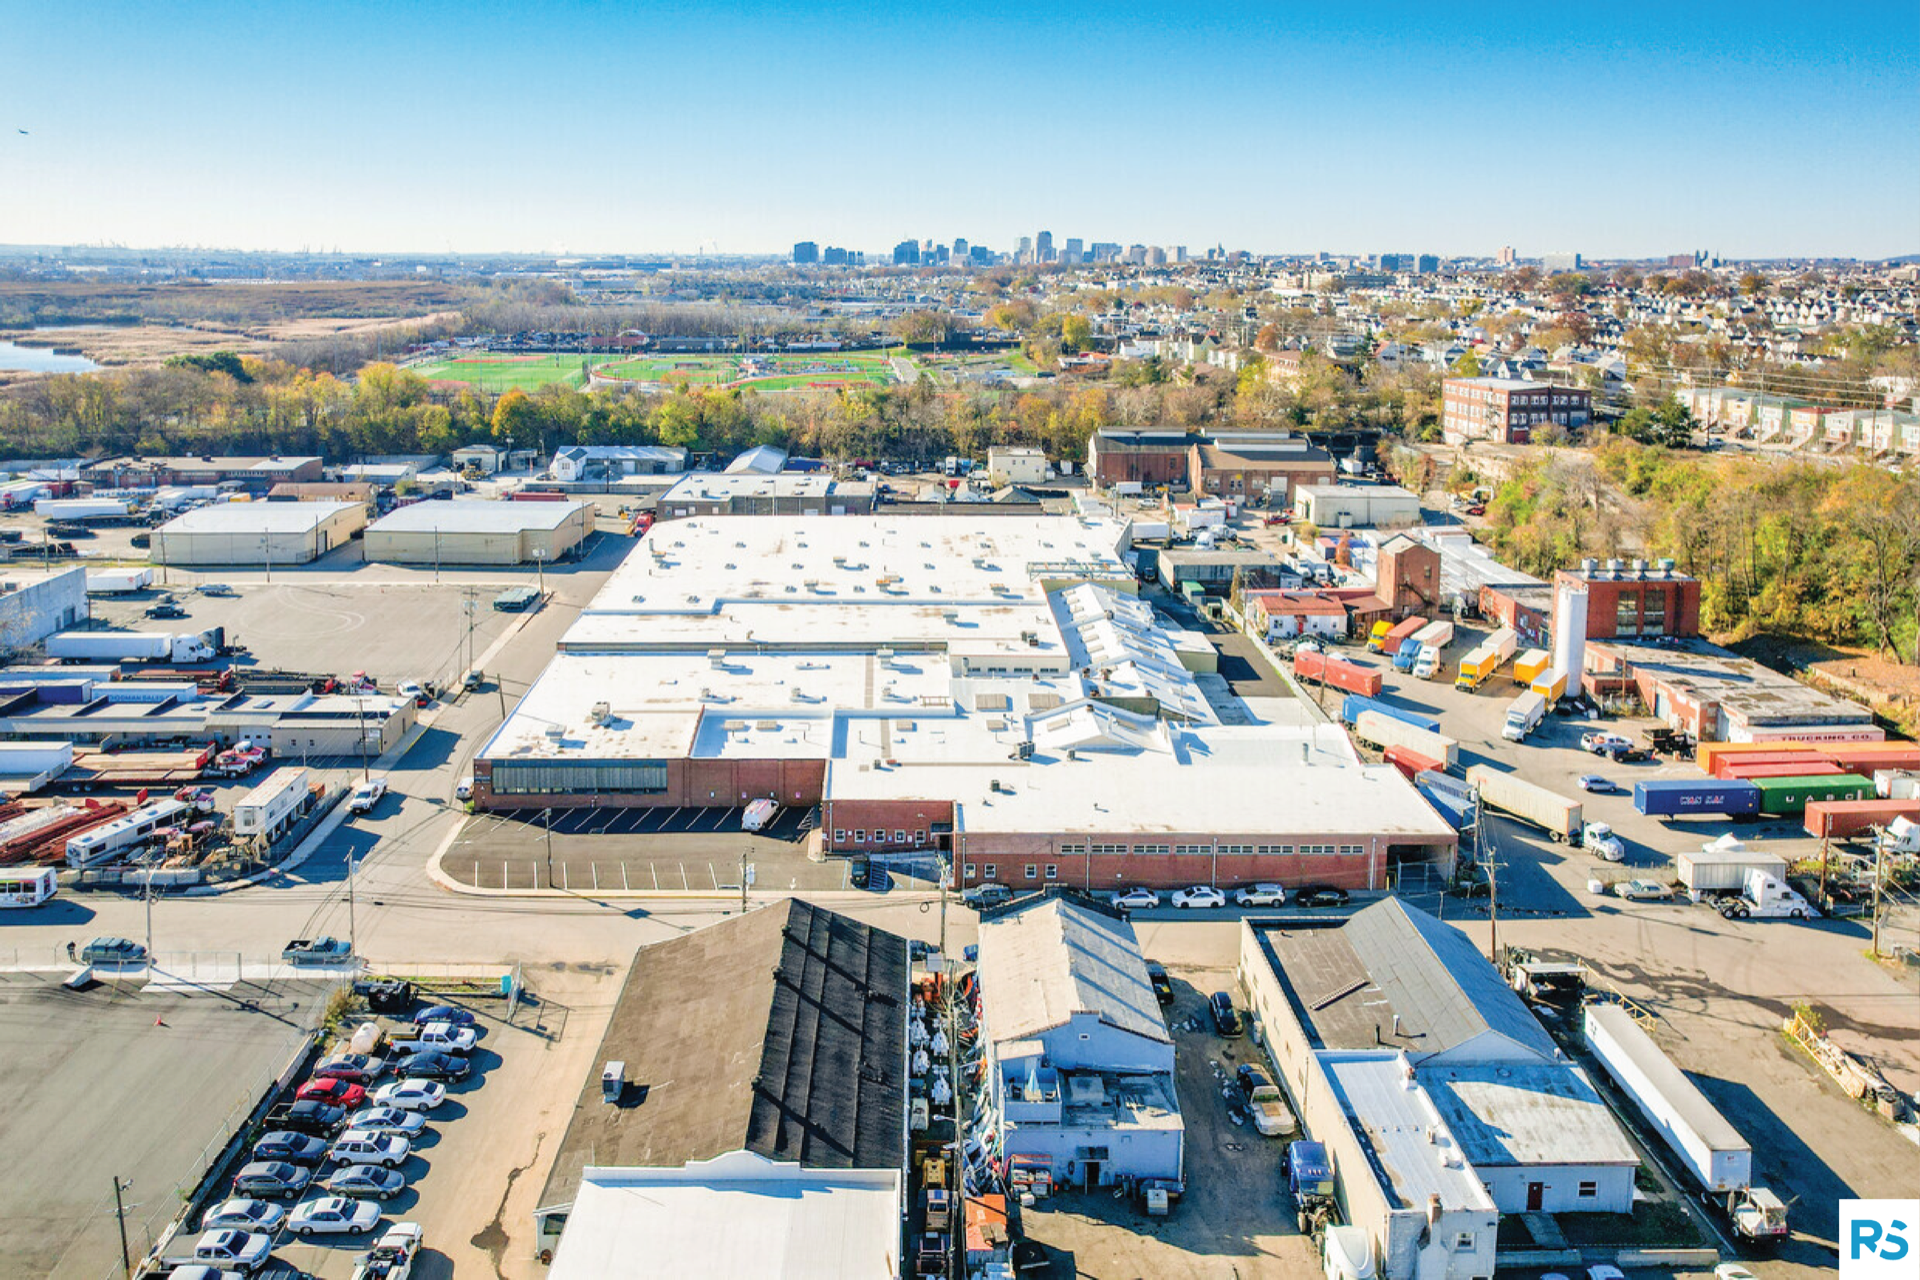
Northern New Jersey / Meadowlands & Port
The logistics backbone of the metro, anchored by the Port of New York and New Jersey (Newark/Elizabeth) and the Meadowlands’ proximity to Manhattan. Deepest modern inventory and most of the region’s Class A leasing. Class A tightening; older product softer. Rents: ~$16–$24/SF NNN.
Central NJ / Exit 8A
The big-box and bulk distribution corridor along the NJ Turnpike, serving regional and national distribution into the Northeast. More available large-format product and the metro’s best big-box value. Rents: ~$12–$16/SF NNN.
Long Island
A supply-constrained, demand-rich submarket serving Nassau, Suffolk, and eastern Queens. Limited new construction keeps it tight, with steady last-mile and local-distribution demand. Rents: ~$18–$24/SF NNN.
| Submarket | Profile | Rent Range (NNN/SF) | Q1 2026 Notes |
|---|---|---|---|
| Outer Boroughs | Last-mile core | $25–$35 | Highest rents in U.S.; +8.6% YoY |
| N. NJ / Meadowlands & Port | Logistics backbone | $16–$24 | Class A tightening, older product softer |
| Central NJ / Exit 8A | Big-box bulk | $12–$16 | Best big-box value, more availability |
| Long Island | Supply-constrained infill | $18–$24 | Tight, steady last-mile demand |
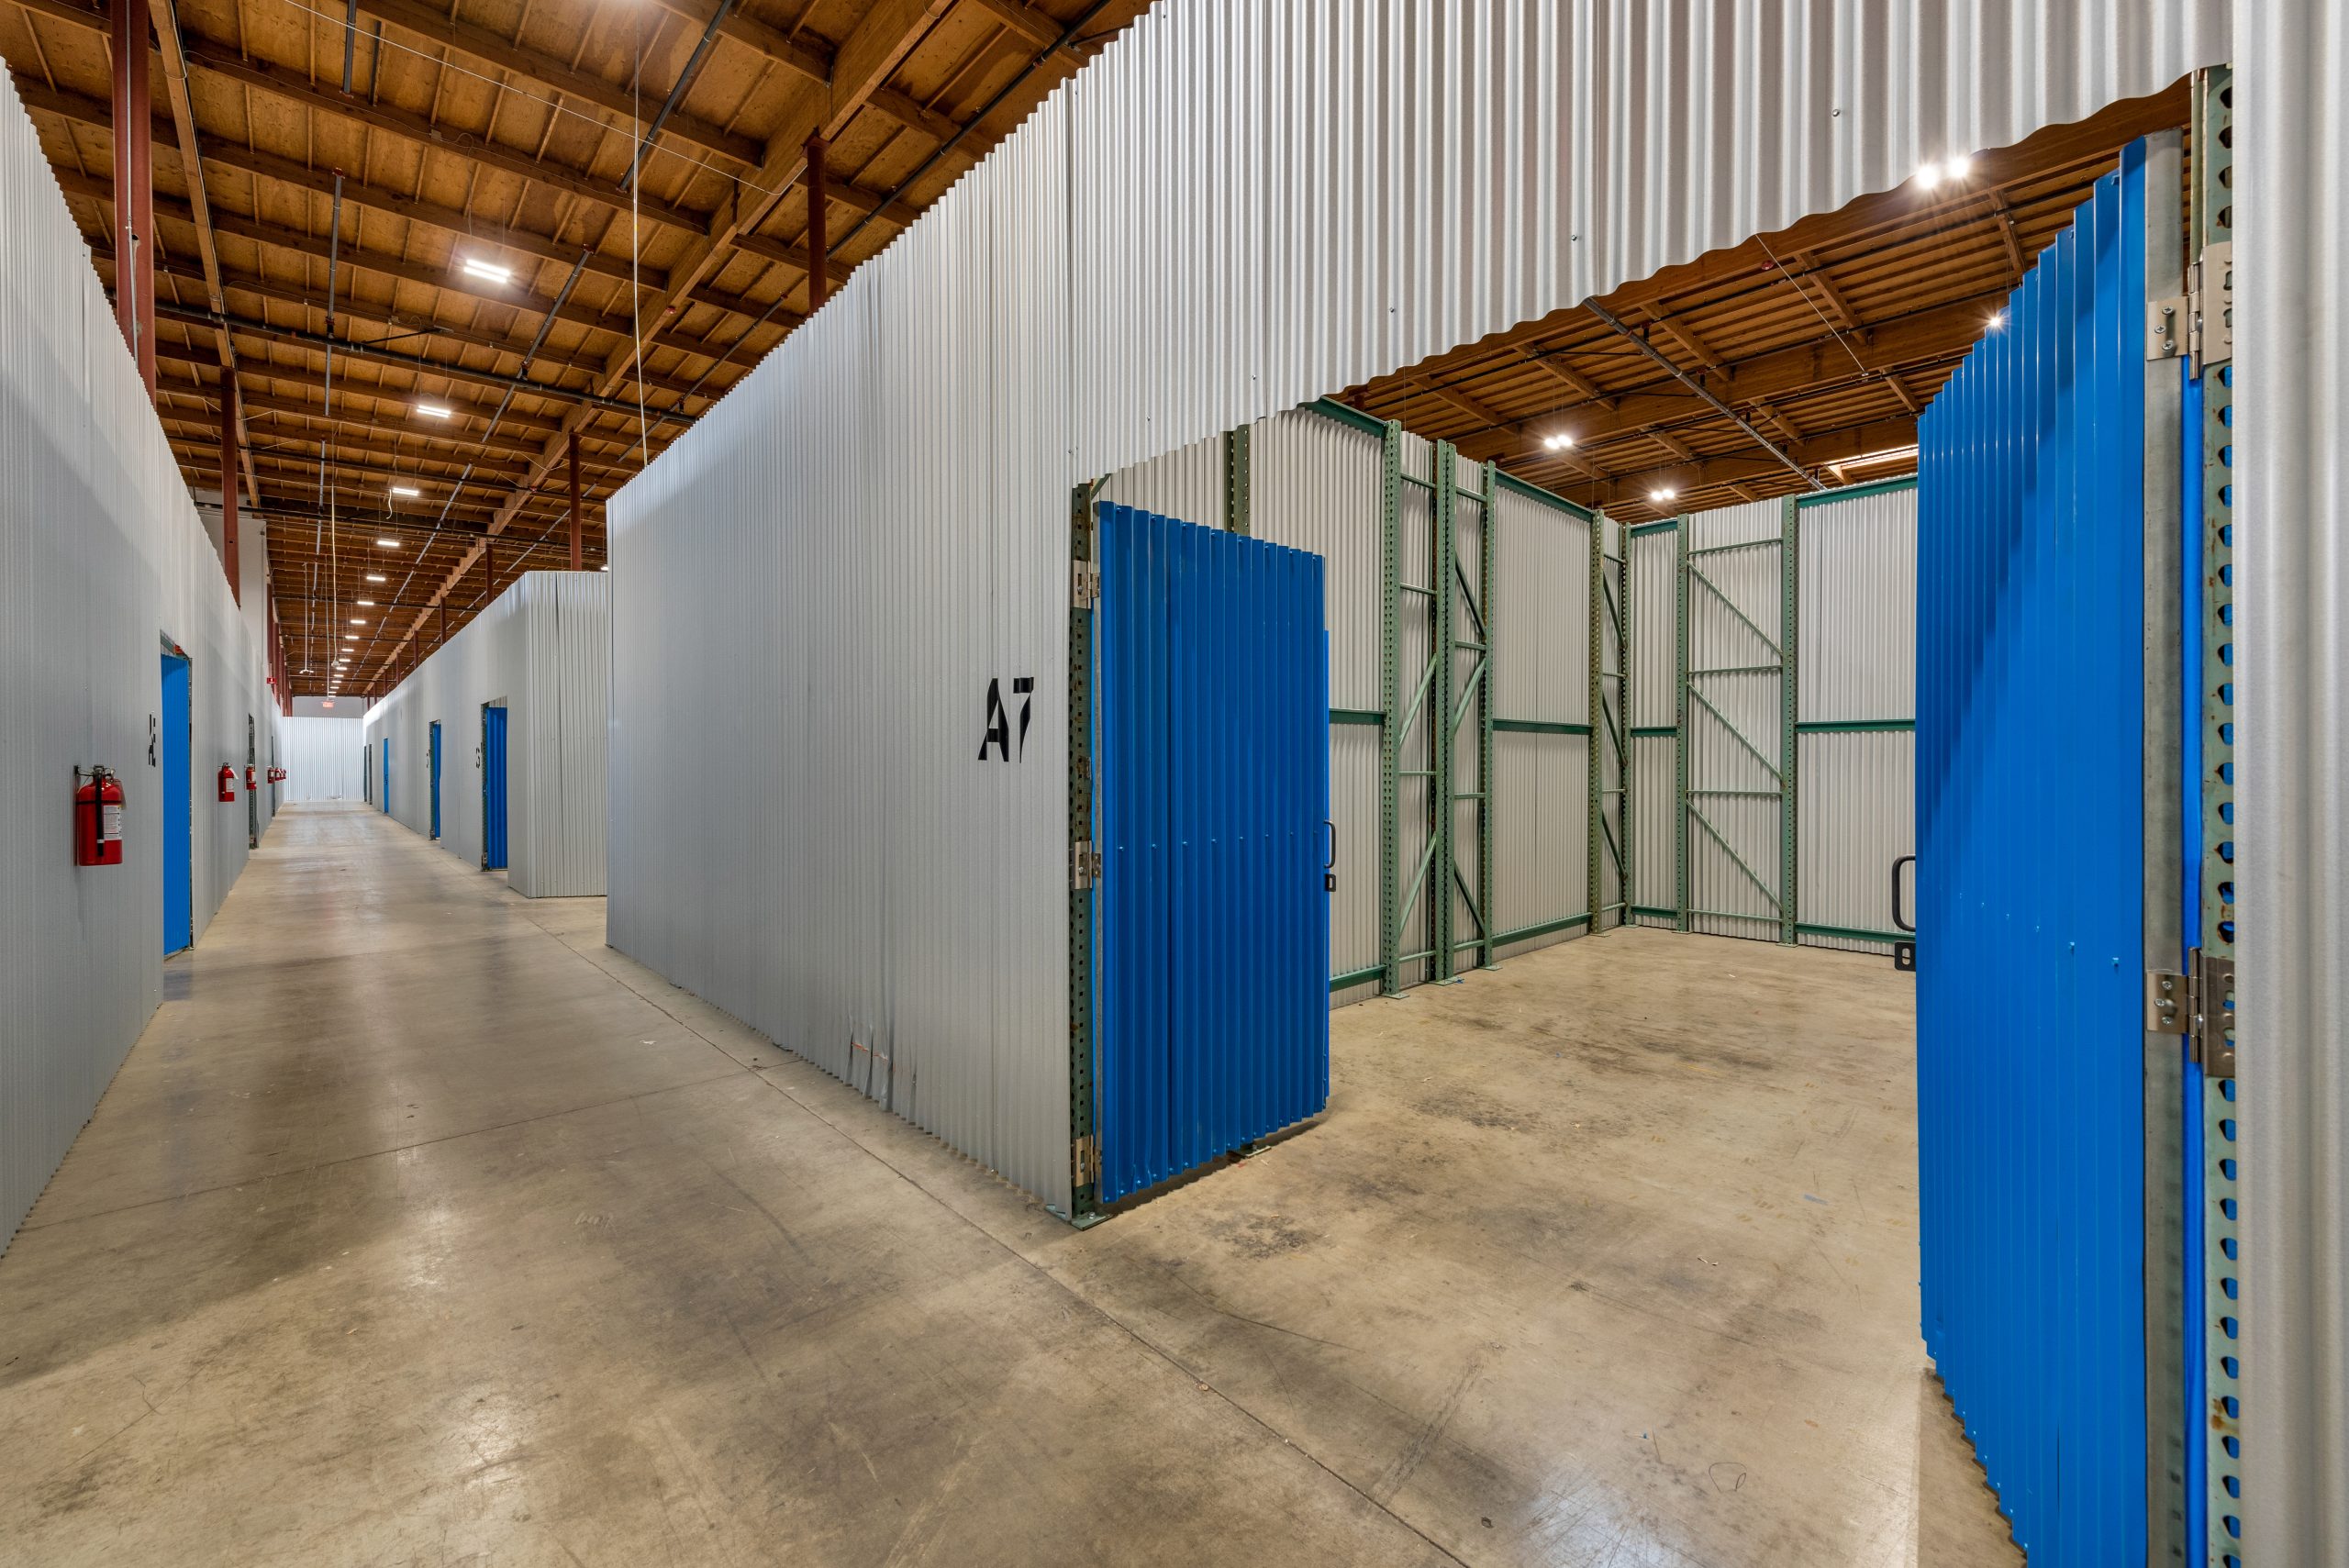
Co-Warehousing & Flexible Warehouse Space in New York City
New York’s flexible warehouse market is defined by scarcity and price. With developable land almost nonexistent in the boroughs, small-bay and flex space close to the consumer is among the most sought-after — and most expensive — in the country. For the thousands of small businesses that need a foothold near the urban core, flexible space is often the only practical option.
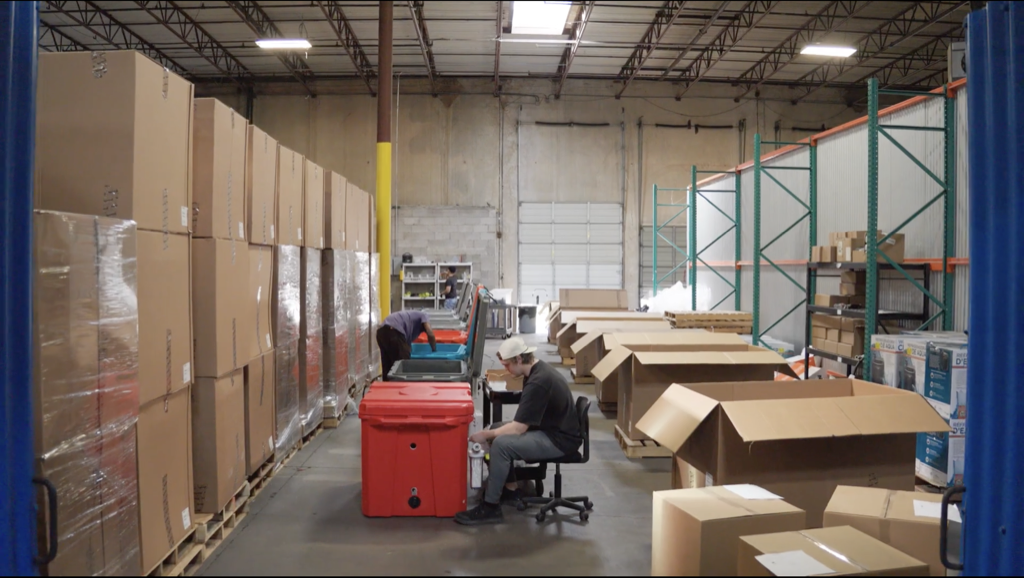
Who’s leasing flexible space in New York City: last-mile and e-commerce operators serving 20 million consumers, contractors and building trades working the metro’s construction market, food and beverage and specialty distributors, importers moving goods through the Port of New York and New Jersey, and growing businesses that need scalable space without a Class A commitment.
Browse available co-warehousing and small-bay warehouse listings on WareCRE’s New York City marketplace.
Looking for warehouse space in New York City?
Key Trends to Watch
1. Flight to Quality
The defining dynamic of the NYC metro this cycle is the separation between modern Class A space and older product. Creditworthy occupiers are consolidating into the best buildings, driving Class A vacancy down and holding rents firm, while older product gives space back. The gap is visible in both occupancy and rent. Read more: Small-Bay vs. Big-Box: What the Vacancy Gap Means in 2026.
2. Last-Mile Scarcity Is Structural
The Outer Boroughs setting national rent records isn’t a cyclical quirk — it’s the predictable result of serving the country’s densest consumer market from a shrinking supply of close-in land. That scarcity underpins the metro’s rents and won’t resolve through construction. For broader context: Industrial Real Estate Trends & Outlook 2026.
3. The Port and Tariff-Driven Demand
The Port of New York and New Jersey is the busiest on the East Coast, and its import volumes shape Northern NJ warehouse demand. As tariffs and supply-chain strategy shift inventory positioning, well-located NJ logistics space stays central to serving the Northeast. See: How Tariffs Are Reshaping Warehouse Demand in 2026.
Outlook: What to Watch in Q2–Q3 2026
The New York metro enters mid-2026 as a high-priced, bifurcated market where quality and location set the terms.
Expect Class A to stay firm on continued flight-to-quality demand, while older product and the five-borough average see more pressure. Northern NJ absorption should remain positive as new Class A leases up.
Rents should hold at premium levels, with the Outer Boroughs continuing to lead nationally and older-product rents softening. Net metro rent growth stays muted as the two segments pull in opposite directions.
The biggest opportunity is for tenants who can use functional older space or newly delivered Northern NJ supply to find value — and for owners who can deliver or reposition modern, well-located product into a quality-hungry market.
Find warehouse space in New York City
Browse co-warehousing, small-bay, and distribution listings across the five boroughs and Northern NJ.
Data sources: Matthews Real Estate New York Industrial Q1 2026, Savills Northern New Jersey Industrial Q1 2026, Cushman & Wakefield New York City Area & New Jersey MarketBeats Q1 2026, JLL New Jersey Industrial Q1 2026, Newmark Northern New Jersey Q1 2026, ROI-NJ and Real Estate NJ (April 2026), WareCRE marketplace data (May 2026).
Related Resources
Frequently Asked Questions
What is the current industrial vacancy rate in New York City?
Five-borough industrial vacancy was about 7.5% in Q1 2026 (availability ~9.2%), edging up as some new supply delivered. Northern New Jersey posted its third straight positive quarter with about 3.7 million SF of net absorption.
How much does warehouse space cost in New York City?
NYC averages about $22.64/SF NNN — among the highest in the nation — and the Outer Boroughs reached $28.59/SF, up 8.6% year-over-year and the most expensive industrial space in the U.S. Northern NJ net asking rents are near $16.66/SF.
Where is the value for warehouse tenants in the NYC metro?
In older Class B/C product and in Northern NJ submarkets digesting new Class A supply. Last-mile space in the Outer Boroughs is scarce and pricey, but functional older buildings and Central NJ big-box offer more negotiating room.
Which NYC-area submarket is best for warehouse space?
The Outer Boroughs are best for last-mile but the most expensive. Northern NJ/Meadowlands & Port is the modern logistics backbone. Central NJ/Exit 8A offers the best big-box value, and Long Island is tight but serves steady last-mile demand.