Miami Industrial & Warehouse Market Report | Q2 2026
Key Takeaways
- Miami-Dade industrial vacancy held at 6.3% in Q2 2026, flat against Q1 as restated and up 30 basis points year over year.
- Net absorption turned positive at 409,469 SF after −147,768 SF in Q1 (restated), bringing the first half to +261,701 SF. Six leases over 100,000 SF were signed in the quarter.
- The overall asking rent was $15.73/SF/yr NNN, flat on the quarter but down 5.3% year over year. Warehouse/distribution space asks $15.56/SF/yr, down 6.1%.
- Supply is slowing. About 829,000 SF delivered in the first half, the lowest first-half volume since 2014, and 2.56 million SF is under construction with about 11% preleased.
Browse warehouse space for rent in Miami
6.3%
Overall Vacancy (Q2 2026)
$15.73
Avg. Asking Rent ($/SF/yr NNN)
409K
SF Net Absorption (Q2 2026)
2.56M
SF Under Construction
Miami-Dade’s industrial market steadied in Q2 2026. Net absorption swung back to 409,469 SF after a negative first quarter, vacancy held at 6.3%, and asking rents were flat on the quarter at $15.73/SF/yr. On the year, vacancy is up 30 basis points and rents are down 5.3% after more than 4.5 million SF of new product delivered since the start of 2025.
Figures are from Cushman & Wakefield’s Q2 2026 Miami-Dade Industrial MarketBeat unless noted. Prior-quarter and year-ago comparisons use the figures as restated in C&W’s Q2 2026 U.S. Industrial MarketBeat tables; C&W originally published Q1 vacancy at 6.5%. The series covers Miami-Dade County only, 182.8 million SF. Broward and Palm Beach counties are tracked separately and are not included. Rents are net asking, quoted in $/SF/yr.
Market Snapshot: Q2 2026
| Metric | Q2 2026 | Q1 2026 (restated) | YoY or note |
|---|---|---|---|
| Overall vacancy | 6.3% | 6.3% | ↑30 bps YoY (6.0% in Q2 2025) |
| Overall asking rent ($/SF/yr NNN) | $15.73 | $15.74 | −5.3% YoY (from $16.61) |
| Warehouse/distribution asking rent ($/SF/yr) | $15.56 | n/a | −6.1% YoY; W/D vacancy 7.1% |
| Net absorption | 409,469 SF | −147,768 SF | 261,701 SF year to date |
| Leasing activity | 1.44M SF | n/a | 2.86M SF year to date, 15.0% behind the 2025 pace |
| Deliveries | 829,489 SF year to date | n/a | Lowest first-half volume since 2014; quarterly split not restated |
| Under construction | 2.56M SF | n/a | About 11.0% preleased; 2.0M SF due by year-end 2026 |
| Inventory | 182.8M SF | n/a | Miami-Dade County; 156.7M SF is warehouse/distribution |
Source: Cushman & Wakefield, Miami-Dade Industrial MarketBeat Q2 2026. Q1 2026 and Q2 2025 values as restated in C&W’s U.S. Industrial MarketBeat Q2 2026 metro tables. n/a = not restated in the Q2 reports.
On the capital side, the four Q2 sales C&W lists traded at $264 to $338 per SF. The largest was TA Realty’s $47.6 million purchase of a 170,765 SF Airport West portfolio, at $279 per SF. C&W’s MarketBeat does not publish a Miami-Dade cap rate.
Rent Trends: Flat on the Quarter, Down 5.3% on the Year
The weighted average asking rent was $15.73/SF/yr NNN in Q2 2026, against $15.74 in Q1 as restated and $16.61 a year earlier, a 5.3% annual decline. Warehouse/distribution space, 156.7 million SF of the 182.8 million SF inventory, asks $15.56/SF/yr, down 6.1% on the year. Manufacturing space asks $16.42/SF/yr and office service/flex $20.00/SF/yr.
The quarterly figures suggest the decline paused in Q2. The overall rate fell from $16.48 in Q4 2025 to $15.74 in Q1 2026, then held. By submarket, asking rents run from $12.79/SF/yr in North Central Dade, the highest-vacancy large submarket at 9.7%, to $17.95/SF/yr in Airport West. Northeast Dade, a small 3.2 million SF submarket at 1.5% vacancy, asks $29.78/SF/yr.
For Tenants
Tenants with big-block requirements have the most room. Warehouse/distribution vacancy is 7.1%, and North Central Dade (9.7%) and Miami Lakes (9.6%) have the highest vacancy rates in the county. Asking rents are 5.3% below a year ago, so benchmark renewals against today’s rates rather than 2025 terms. Manufacturing and flex space is far tighter, at 1.5% and 1.9% vacancy, and Hialeah (2.8%) and Airport East/Downtown (3.0%) have little availability. Search Miami warehouse listings on WareCRE.
Construction Pipeline: 2.56M SF Underway, Lowest First-Half Deliveries Since 2014
Miami-Dade had 2,557,525 SF under construction at the end of Q2 2026, about 1.4% of inventory, down from 2,752,730 SF at the end of Q1 as originally published. About 11.0% of the active pipeline is preleased, and C&W expects 2.0 million SF to deliver by year-end 2026. All of the space under construction is warehouse/distribution.
Deliveries have slowed sharply. First-half completions totaled about 829,000 SF, the lowest first-half volume since 2014, after more than 4.5 million SF delivered since the start of 2025. Airport West has 1,540,624 SF of the pipeline underway, about 60% of the total, followed by Northwest Dade (653,434 SF) and Airport North/Medley (363,467 SF).
For Operators
The near-term risk is the year-end delivery slate. About 2.0 million SF is due by year-end, and only about 11% of the pipeline is preleased, so much of that space is likely to deliver without a tenant. Airport West holds 1.5 million SF of the pipeline. Owners of existing manufacturing and flex product face no new competition, because none of the pipeline is manufacturing or office service/flex space.
Submarket Breakdown: Airport West Leads, North Central Dade Is Softest
C&W tracks nine Miami-Dade submarkets. The four below account for 95% of year-to-date leasing and all of the space under construction.
Airport West
The largest submarket at 48.4 million SF, west of Miami International Airport around Doral. Vacancy is 5.1% and the overall asking rent is $17.95/SF/yr, the highest of the large submarkets. It led the county with 177,090 SF of net absorption and 1.02 million SF of leasing year to date, and it holds 1,540,624 SF of the pipeline. In Q2, TA Realty paid $47.6 million ($279 per SF) for a 170,765 SF portfolio here.
Airport North/Medley
38.4 million SF north of the airport through Medley, at 7.2% vacancy and $16.95/SF/yr. Year-to-date absorption is roughly flat at −1,308 SF on 863,570 SF of leasing. 197,643 SF delivered in the first half and 363,467 SF more is under construction. Withers Transfer and Storage renewed and expanded into 227,088 SF, and AMG Global Distribution renewed 159,180 SF.
North Central Dade
34.5 million SF with the highest vacancy of the large submarkets at 9.7% and the lowest overall asking rent in the county at $12.79/SF/yr. It gave back 60,555 SF year to date but landed the quarter’s largest lease, Ryder System’s 409,189 SF new lease. Packaging Corporation of America renewed 174,400 SF. No new space is under construction here.
Northwest Dade
12.7 million SF at 7.2% vacancy and $15.75/SF/yr. It posted the second-highest year-to-date absorption in the county at 130,900 SF, and its 653,434 SF pipeline is the second largest after Airport West.
| Submarket | Inventory (SF) | Vacancy | Asking Rent ($/SF/yr) | YTD Net Absorption (SF) | Under Construction (SF) |
|---|---|---|---|---|---|
| Airport West | 48.4M | 5.1% | $17.95 | 177,090 | 1,540,624 |
| Airport North/Medley | 38.4M | 7.2% | $16.95 | −1,308 | 363,467 |
| North Central Dade | 34.5M | 9.7% | $12.79 | −60,555 | 0 |
| Airport East/Downtown | 23.4M | 3.0% | $15.71 | 2,745 | 0 |
| Northwest Dade | 12.7M | 7.2% | $15.75 | 130,900 | 653,434 |
| South Dade | 9.0M | 7.0% | $16.63 | −9,181 | 0 |
| Hialeah | 8.0M | 2.8% | $17.14 | 15,738 | 0 |
| Miami Lakes | 5.2M | 9.6% | $16.63 | 15,618 | 0 |
| Northeast Dade | 3.2M | 1.5% | $29.78 | −9,346 | 0 |
| Miami-Dade total | 182.8M | 6.3% | $15.73 | 261,701 | 2,557,525 |
Source: Cushman & Wakefield, Miami-Dade Industrial MarketBeat Q2 2026, market statistics table. Rents are overall weighted net asking rents.
Co-Warehousing & Flexible Warehouse Space in Miami
C&W does not publish a small-bay breakout for Miami-Dade, but its product-type split shows where space is tightest. Office service/flex space, 8.8 million SF, is 1.9% vacant and asks $20.00/SF/yr. Manufacturing space is 1.5% vacant. Both are far tighter than warehouse/distribution at 7.1%, and none of the 2.56 million SF under construction falls in either category, so no new supply is coming to these segments.
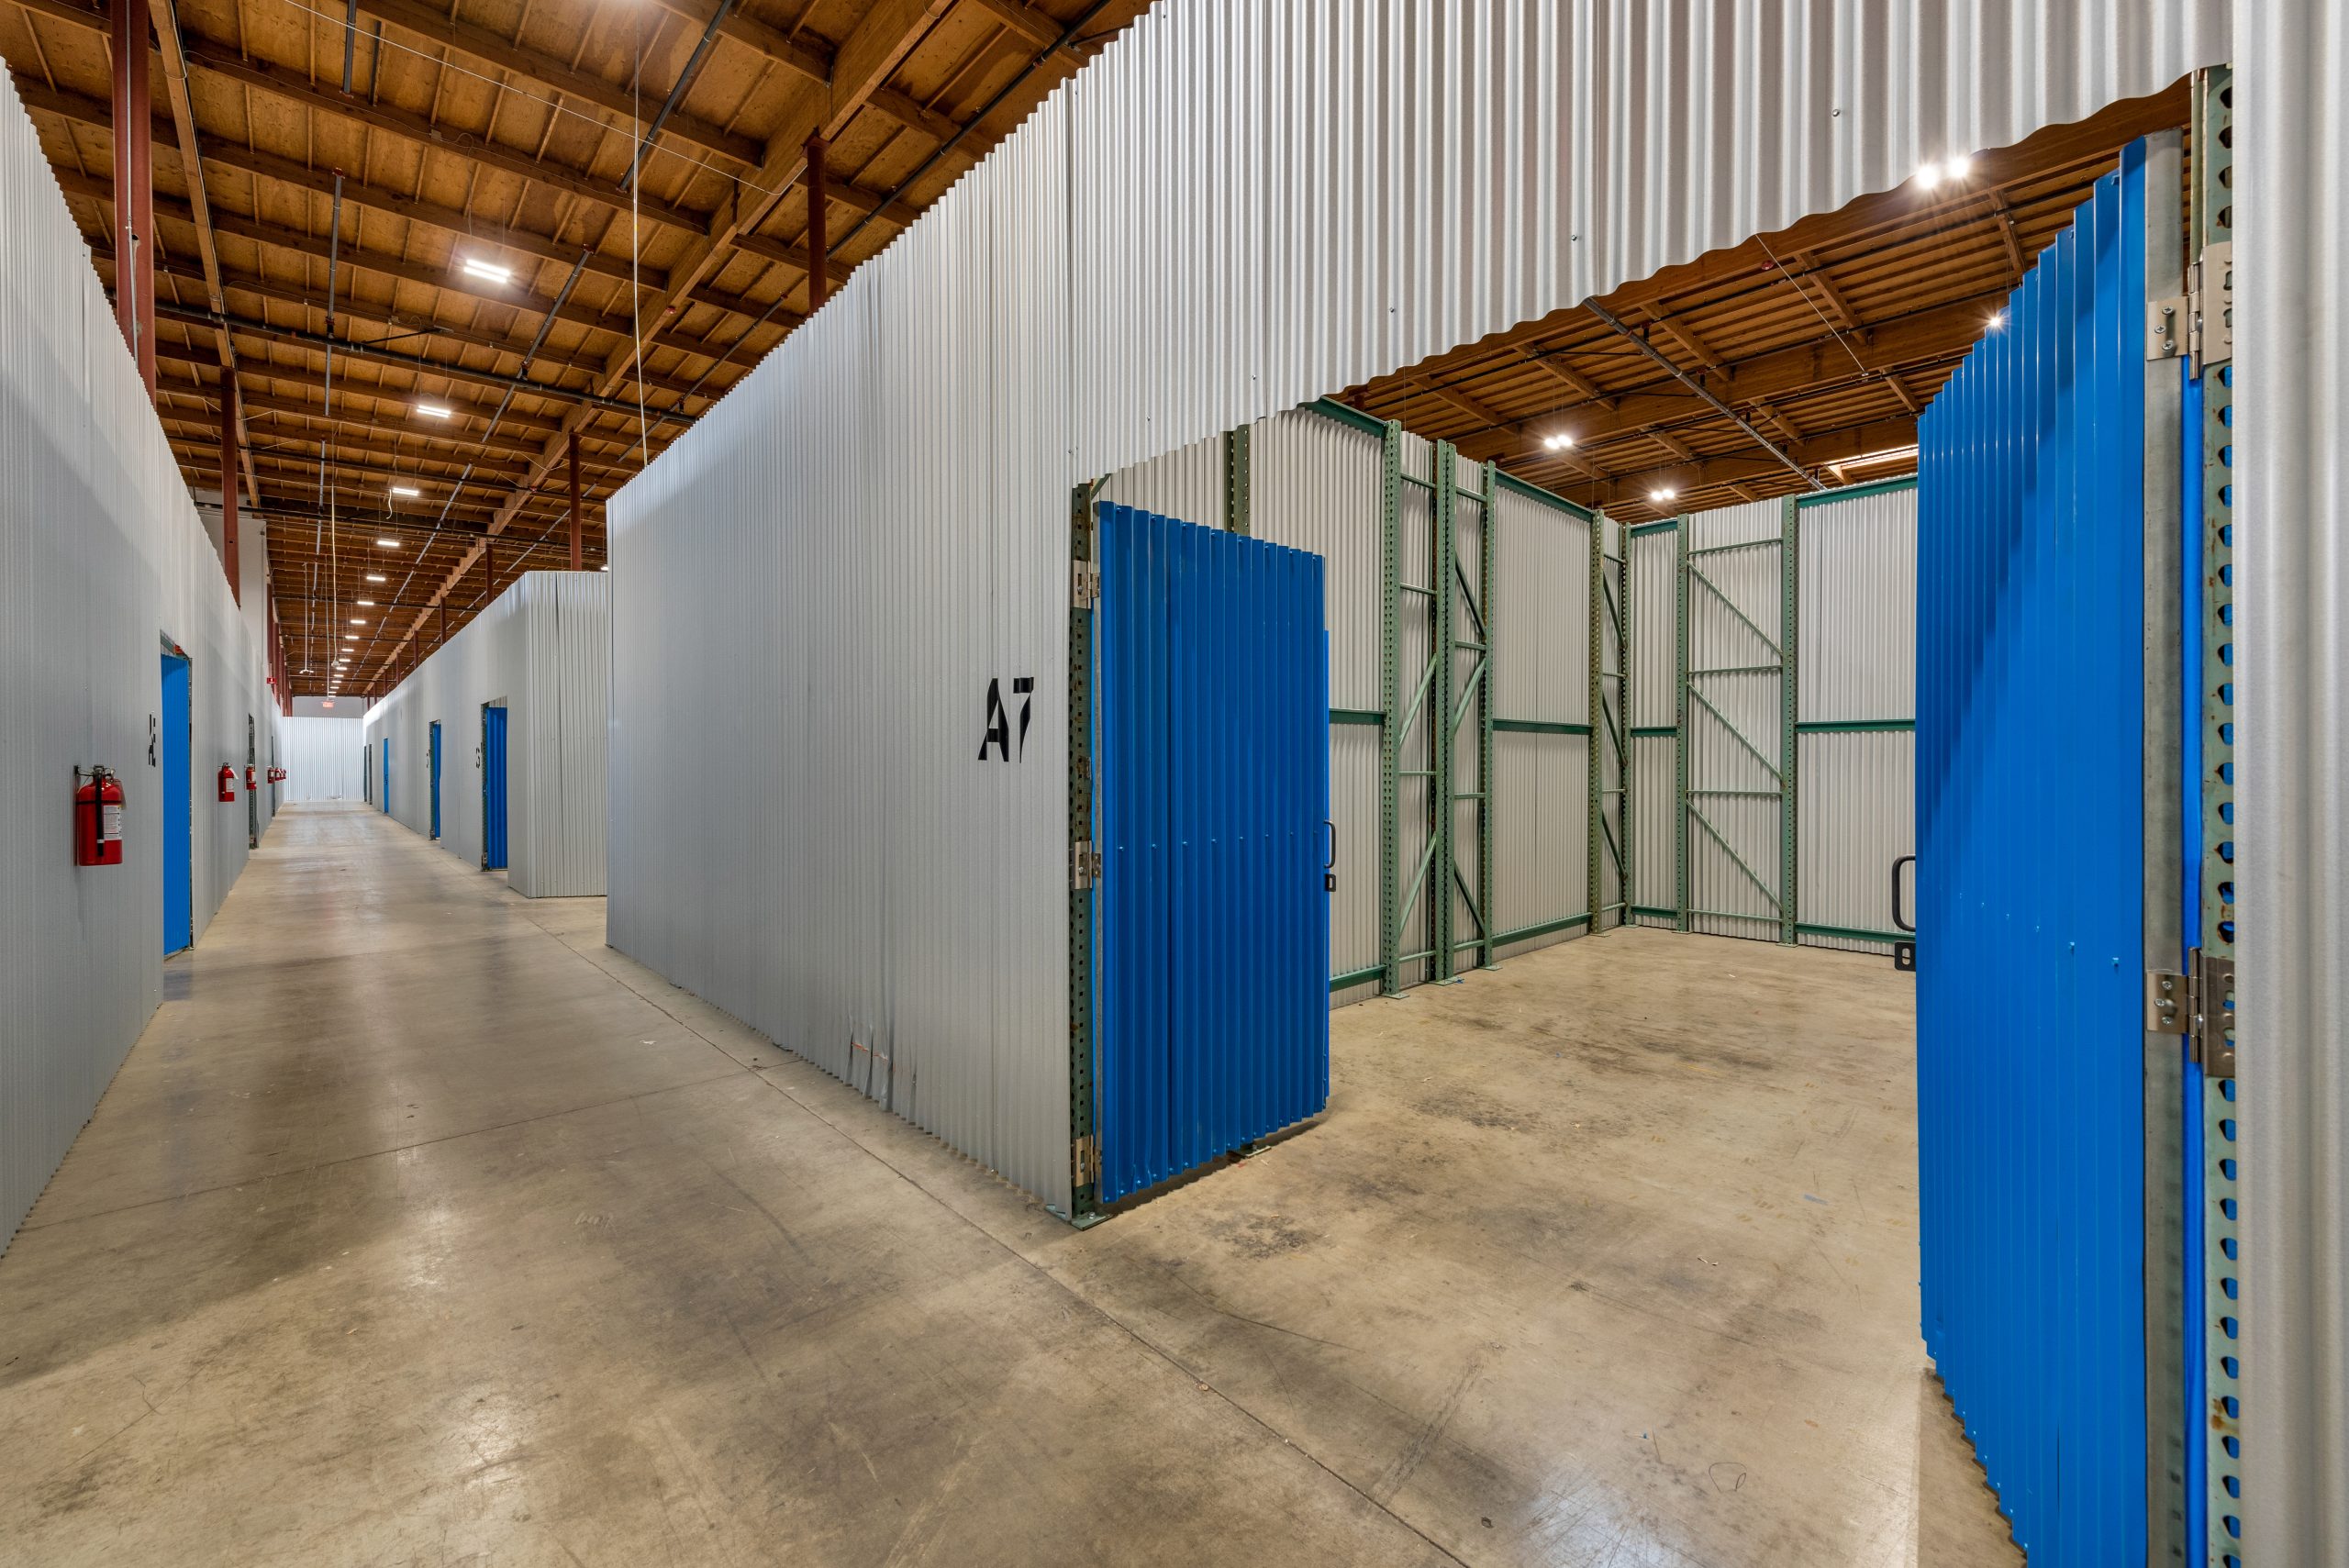
Co-warehousing and flexible warehouse space serves businesses that need operational space without a multi-year big-box lease. WareCRE’s Miami listings include small-bay and flex space in Doral, Medley and Hialeah. For the national picture, see Small-Bay vs. Big-Box: What the Vacancy Gap Means in 2026.
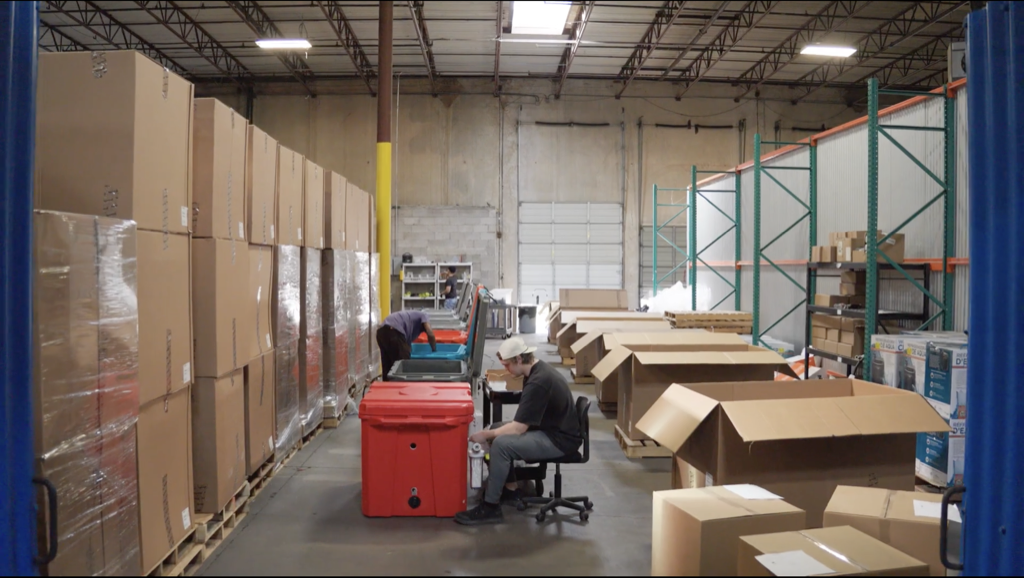
Miami’s flexible-space demand comes from e-commerce operators needing fulfillment space near the county’s population centers, contractors storing tools and materials, food producers serving South Florida’s hospitality industry, and import/export businesses working the trade routes through PortMiami and Miami International Airport.
Browse available co-warehousing and small-bay warehouse listings on WareCRE’s Miami marketplace.
Looking for warehouse space in Miami?
Key Trends to Watch
1. Demand Came Back in Q2, Led by Large Leases
Six leases over 100,000 SF were signed in Q2, bringing the year-to-date count to 14, up from 12 at the same point in 2025. Ryder System’s 409,189 SF new lease in North Central Dade was the largest. Net absorption of 409,469 SF reversed a negative Q1 (−147,768 SF as restated), and C&W expects about 3.5 million SF of already-leased space to occupy by year-end 2026.
2. Total Leasing Volume Is Running Below 2025
C&W counted about 1.4 million SF of new leasing in Q2 and nearly 2.9 million SF in the first half, 15.0% behind the pace set in 2025. The large-deal count is up even as total volume is down. Vacancy follows absorption, which depends on how much leased space tenants actually occupy.
3. First-Half Deliveries Were the Lowest Since 2014
About 829,000 SF delivered in the first half of 2026. After more than 4.5 million SF delivered since the start of 2025, the slowdown gives the market time to absorb recent completions. The second half is heavier, with 2.0 million SF due by year-end and only about 11% of the pipeline preleased.
Outlook: What to Watch in Q4 2026
C&W’s Q3 2026 MarketBeats are due in mid-October, with the year-end release to follow.
Watch whether absorption stays positive. The 3.5 million SF of leased space C&W expects to occupy by year-end is the main support, and a second positive quarter would confirm that Q2 was not a one-off.
Watch whether year-end deliveries push vacancy up. About 2.0 million SF is slated to deliver by year-end with roughly 11% of the pipeline preleased. Airport West, with about 60% of the pipeline, carries the most risk.
Watch whether rents have bottomed. Asking rents were $15.74 in Q1 and $15.73 in Q2. Another flat or rising quarter would suggest the reset is over; a renewed drop would mean it has further to run.
Find warehouse space in Miami
Browse co-warehousing, small-bay, and flex listings across Miami-Dade.
Data sources: Cushman & Wakefield Miami-Dade Industrial MarketBeat Q2 2026 (headline, submarket, product-type and transaction figures; rents net asking, $/SF/yr); Cushman & Wakefield U.S. Industrial MarketBeat Q2 2026 (restated Q1 2026, Q4 2025 and Q2 2025 figures; rents NNN); Cushman & Wakefield Miami-Dade Industrial MarketBeat Q1 2026 (Q1 vacancy and pipeline as originally published); WareCRE marketplace listings (September 2026). Each report reflects the most recent vacancy, rental, and construction data available at the time of publication. We refresh our reports as new market data is released, and we’re continually expanding coverage to additional metros.
Related Resources
Frequently Asked Questions
What is the current industrial vacancy rate in Miami?
Miami-Dade industrial vacancy was 6.3% in Q2 2026, according to Cushman & Wakefield, unchanged from Q1 as restated and up 30 basis points from 6.0% a year earlier. Warehouse/distribution vacancy was 7.1%, while manufacturing (1.5%) and office service/flex (1.9%) space was much tighter.
How much does warehouse space cost in Miami?
The overall average asking rent was $15.73/SF/yr NNN in Q2 2026. Warehouse/distribution space averaged $15.56/SF/yr, manufacturing $16.42/SF/yr and office service/flex $20.00/SF/yr. By submarket, rents run from $12.79/SF/yr in North Central Dade to $17.95/SF/yr in Airport West, with small Northeast Dade at $29.78/SF/yr.
Are Miami industrial rents rising or falling?
Falling on the year and flat on the quarter. The Q2 2026 overall asking rent of $15.73/SF/yr is 5.3% below the $16.61 recorded in Q2 2025, and warehouse/distribution rents are down 6.1%. Between Q1 and Q2 2026 the overall rate was essentially unchanged, at $15.74 and $15.73.
Which Miami submarket is best for warehouse space?
It depends on the requirement. Airport West is the largest and most active submarket, at 5.1% vacancy and $17.95/SF/yr. North Central Dade has the highest vacancy of the large submarkets (9.7%) and the lowest rent in the county ($12.79/SF/yr). Hialeah (2.8%) and Airport East/Downtown (3.0%) are close-in options with little availability.
How much industrial space is under construction in Miami?
About 2.56 million SF was under construction in Miami-Dade at the end of Q2 2026, all of it warehouse/distribution, with about 11.0% preleased. Cushman & Wakefield expects 2.0 million SF to deliver by year-end 2026. First-half deliveries were about 829,000 SF, the lowest first-half total since 2014.