Portland Industrial & Warehouse Market Report | Q1 2026
Key Takeaways
- Portland industrial vacancy rose to about 6.5% in Q1 2026 (availability 10.9%) — 15-year highs — as recent deliveries and elevated sublease space outpaced demand. The market has clearly tilted toward tenants.
- Net absorption was negative at roughly −872,000 SF, as occupiers reassessed space needs and decommitted from large blocks amid economic uncertainty.
- In an unusual twist, the small-bay segment (under 50,000 SF) led the weakness, with vacancy more than doubling. Asking rents held up — mid-$0.80s to low-$0.90s/SF NNN per month, up ~7.1% year-over-year — but rising concessions are pressuring effective rents.
- Speculative construction is slowing, which should bring supply and demand back into alignment through 2026–2027. For now, tenants hold strong leverage. Browse Portland warehouse listings on WareCRE.
6.5%
Overall Vacancy (15-yr high)
~$0.90
Avg. Asking Rent (NNN/SF/Mo)
−872K
SF Net Absorption (Q1)
3.1M
SF Under Construction
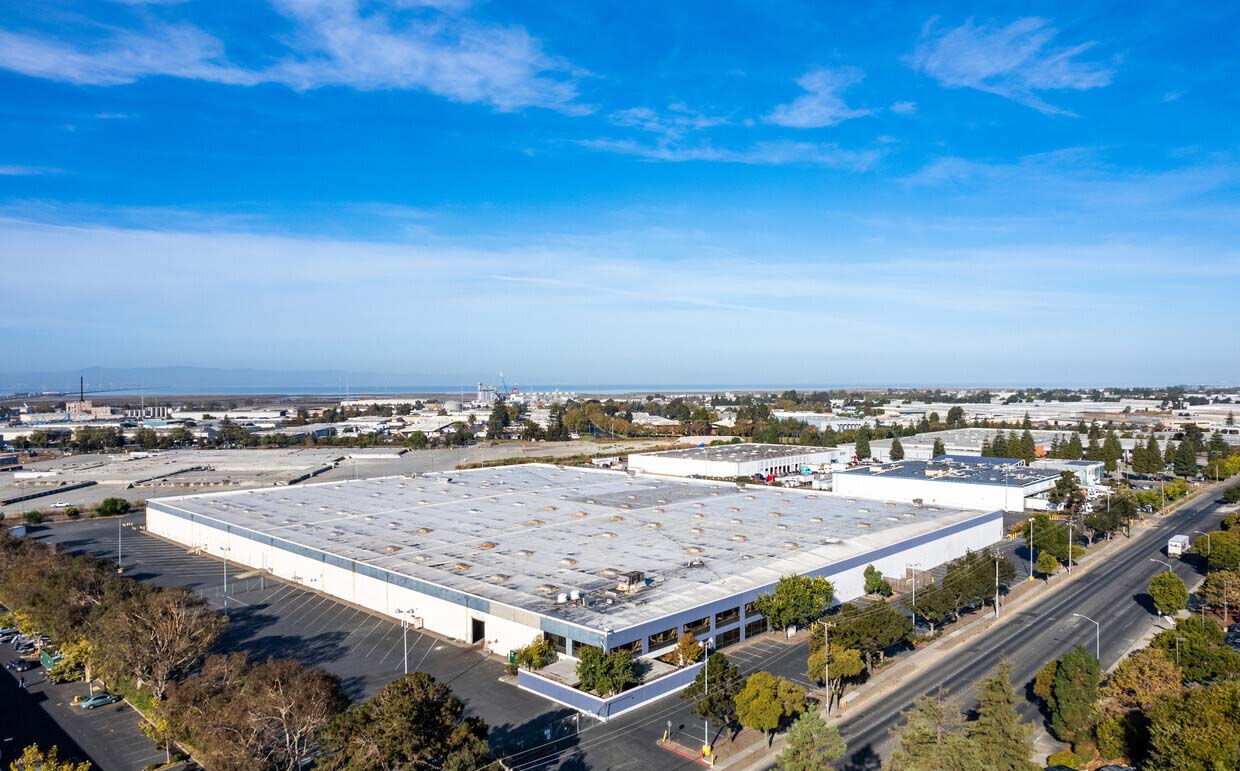
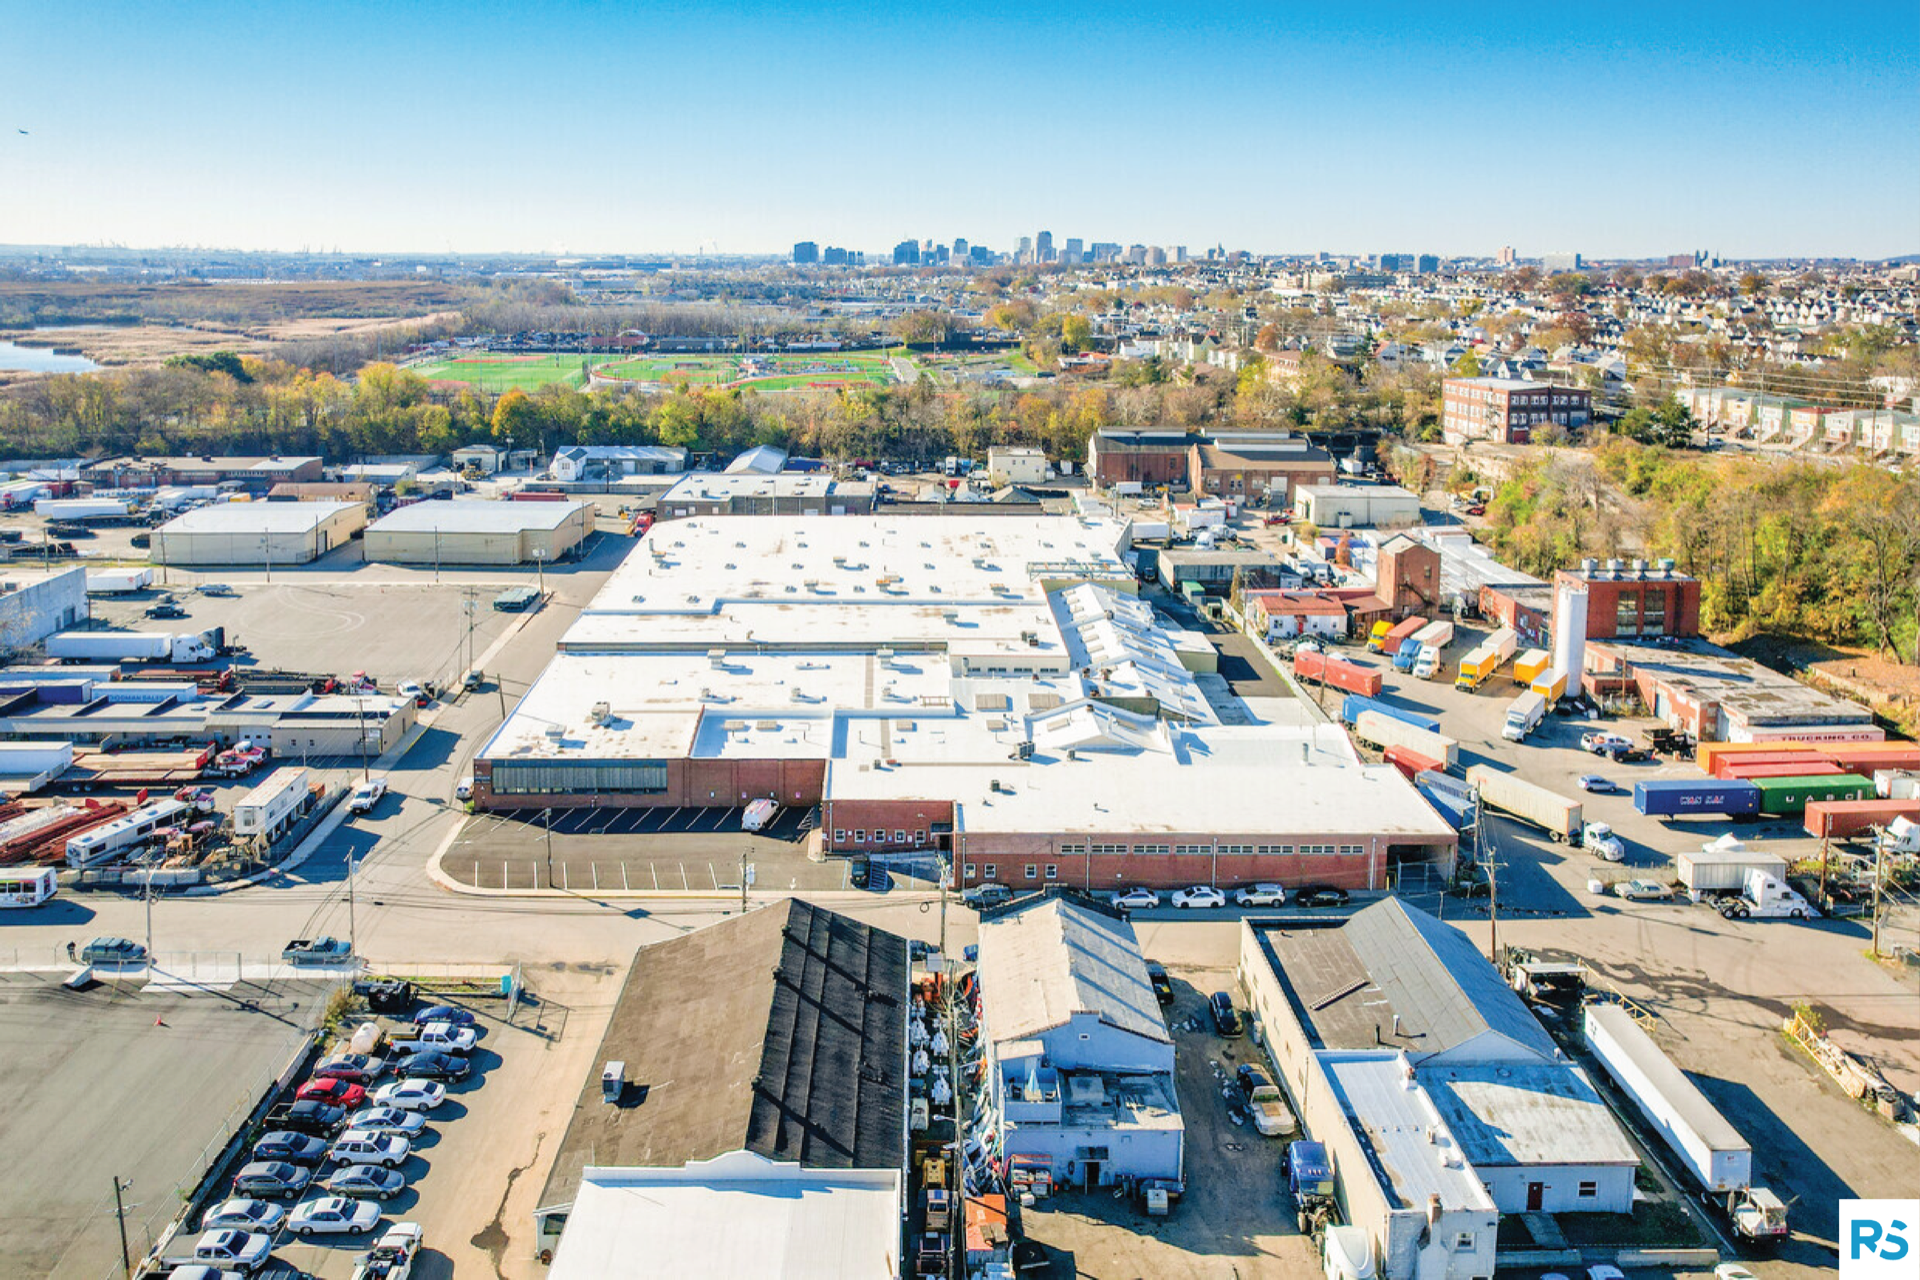
Portland is the Pacific Northwest’s second major industrial market — a logistics and manufacturing hub anchored by the Port of Portland, the I-5 and I-84 corridors, a deep food-and-beverage base, and the “Silicon Forest” semiconductor cluster in Hillsboro. Entering Q1 2026, the market is in a clear soft patch: vacancy has climbed to 15-year highs, absorption is negative, and a wave of recent deliveries plus elevated sublease space has handed tenants the upper hand.
For businesses looking for warehouse space in Portland, this is one of the most negotiable markets in years — and unusually, the leverage extends to small-bay space, where vacancy has more than doubled. With speculative construction now slowing, the imbalance should ease over time. Here’s the full Q1 2026 picture.
Market Snapshot: Q1 2026
| Metric | Q1 2026 | Context |
|---|---|---|
| Overall vacancy | ~6.5% | 15-year high; availability ~10.9% |
| Avg. asking rent | mid-$0.80s–low-$0.90s/SF NNN/mo | ~+7.1% YoY asking; concessions rising |
| Net absorption | ~−872K SF | Negative; decommitments on large blocks |
| Small-bay (<50K SF) | Weak | Vacancy more than doubled — unusual softness |
| Under construction | ~3.1M SF | Spec slowing; rebalancing into 2026–2027 |
| New deliveries | >$1.00/SF NNN/mo | New assets outperform; sublease tempers rents |
Rent Trends: Asking Rents Hold, Effective Rents Soften
Portland warehouse rents are quoted monthly NNN and remain in the mid-$0.80s to low-$0.90s/SF per month range (roughly $10–$11/SF annually), with asking rates actually up about 7.1% year-over-year. But the headline understates tenant leverage: rising concession activity — free rent and improvement allowances — is pressuring effective rents, and elevated sublease availability introduces lower-cost alternatives that temper rent growth.
Newly delivered Class A assets continue to outperform, achieving rents above $1.00/SF per month, while older product and sublease space compete on price. The net effect is a market where the sticker rent looks stable but the real deal — once concessions are counted — favors tenants more than the asking rate suggests.
For Tenants
This is a strong tenant’s market — and unusually, that includes small-bay space, where vacancy has more than doubled. Push hard on concessions: asking rents look steady, but free rent, TI, and sublease alternatives mean effective deals are well below face. Large-block tenants have especially deep options as occupiers decommit space. Search Portland warehouse listings on WareCRE.
Construction Pipeline: Slowing Toward Balance
About 3.1 million SF is under construction in Portland, but speculative development has slowed markedly as builders respond to rising vacancy and softer demand. The deliveries of the past two years are the main driver of today’s elevated vacancy — new supply simply arrived faster than tenants could absorb it — and with the spec pipeline now thinning, supply and demand are expected to move back into alignment through the rest of 2026 and into 2027.
Portland’s underlying fundamentals remain sound: a diverse occupier base spanning logistics, manufacturing, food and beverage, and semiconductors, plus Port of Portland access and the region’s position on the I-5 corridor. The current softness is a supply-and-demand timing issue, not a structural decline.
For Operators
Near term, rising vacancy, negative absorption, and growing concessions argue for prioritizing occupancy over rate — especially for large-block and older product competing with new deliveries and sublease space. The slowing spec pipeline is the constructive signal: as new supply tapers and demand normalizes, the market should rebalance into 2027. Newer, functional assets are holding rate best.
Submarket Breakdown
Northeast / Columbia Corridor & Airport
Portland’s core distribution submarket along the Columbia River and I-205, anchored by PDX airport access. The deepest inventory and a primary driver of leasing activity, though also where recent deliveries have added availability. Rents: ~$0.85–$1.10/SF NNN/mo.
Rivergate / North Portland
The port-driven big-box submarket at the confluence of the Columbia and Willamette, home to the Port of Portland’s marine terminals and the largest distribution product. Import- and logistics-led demand. Rents: ~$0.80–$1.00/SF NNN/mo.
Sunset Corridor / Hillsboro (Silicon Forest)
The western advanced-manufacturing submarket — Oregon’s “Silicon Forest,” anchored by Intel and a deep semiconductor and tech-manufacturing base. More specialized demand that’s held up better than commodity distribution, and a continued activity driver. Rents: ~$0.95–$1.30/SF NNN/mo.
Southwest / I-5 & Clark County (WA)
The I-5 south corridor (Tualatin, Wilsonville) and Clark County, Washington (Vancouver) across the river, offering value pricing and tax advantages. A practical option for cost-sensitive and larger requirements. Rents: ~$0.75–$1.05/SF NNN/mo.
| Submarket | Profile | Rent Range (NNN/SF/Mo) | Q1 2026 Notes |
|---|---|---|---|
| NE / Columbia Corridor | Core distribution | $0.85–$1.10 | Deepest inventory, activity driver |
| Rivergate / North Portland | Port big-box | $0.80–$1.00 | Port of Portland, logistics-led |
| Sunset Corridor / Hillsboro | Silicon Forest | $0.95–$1.30 | Semiconductor/tech, more resilient |
| SW / I-5 & Clark County | Value / suburban | $0.75–$1.05 | Cost-sensitive, WA tax advantages |
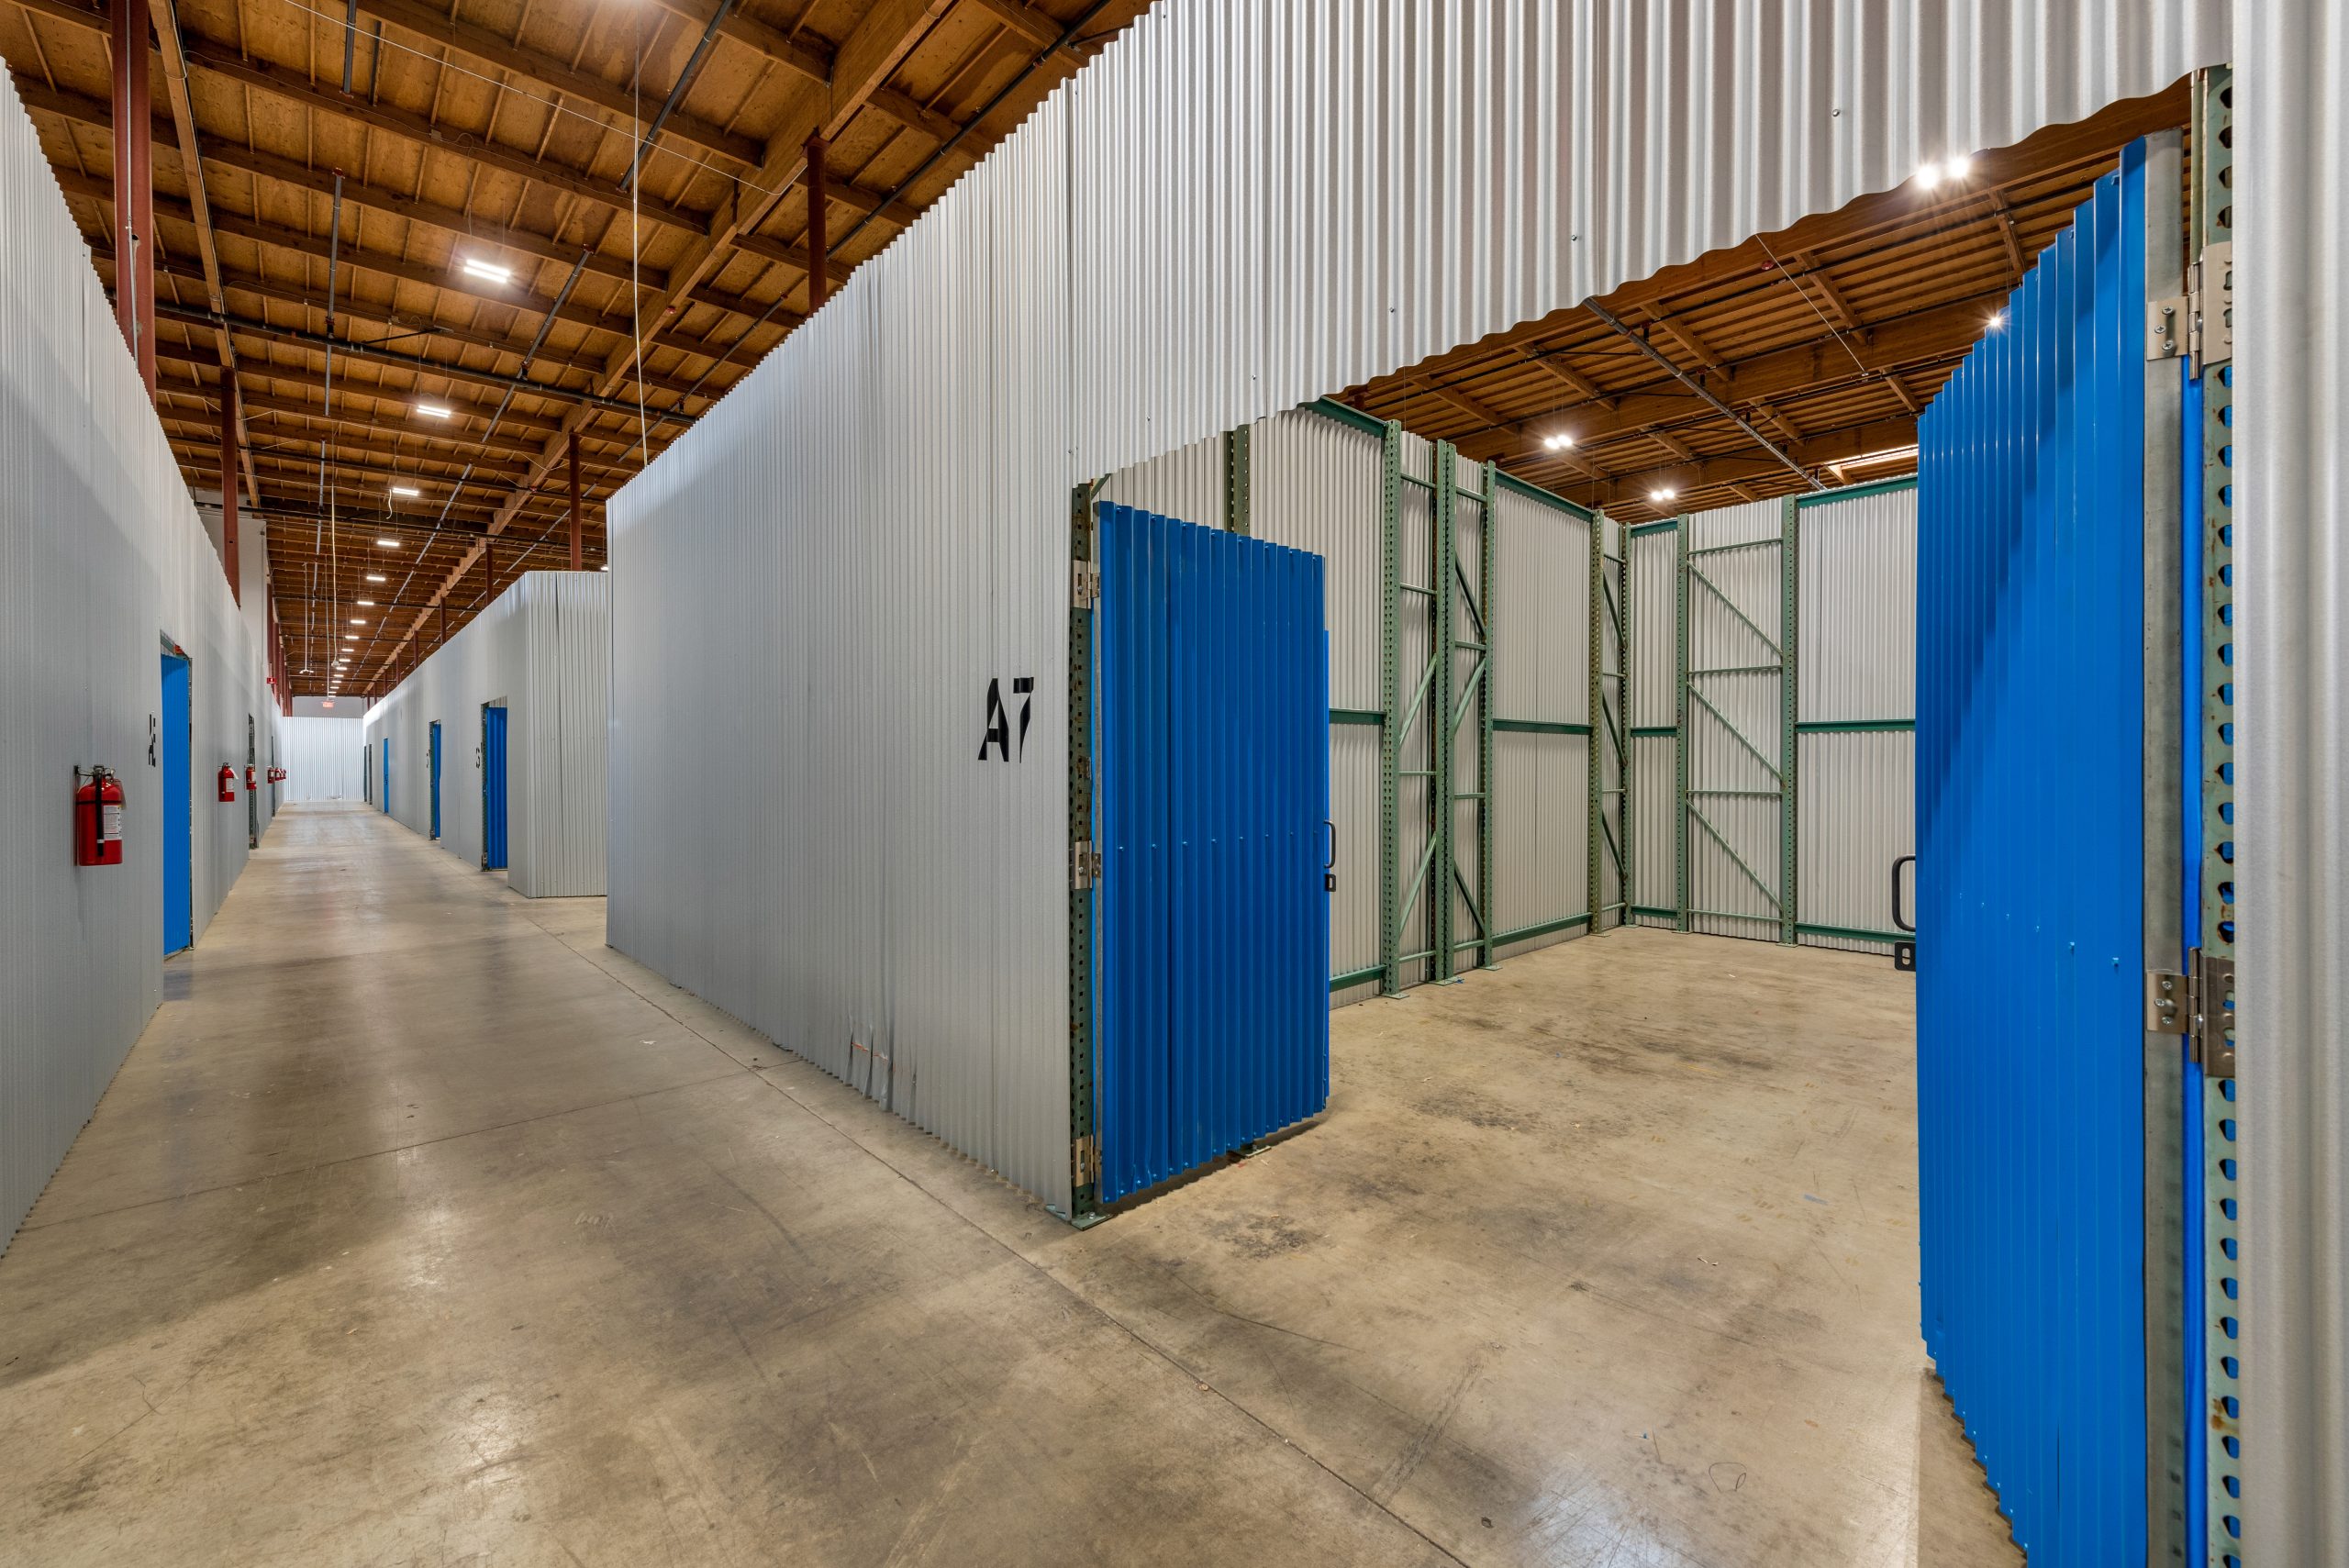
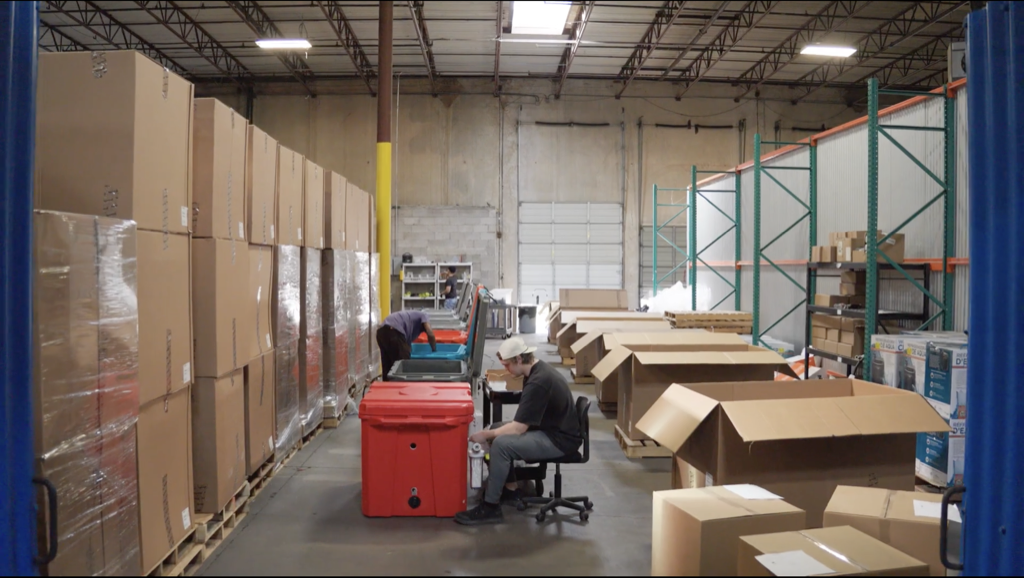
Co-Warehousing & Flexible Warehouse Space in Portland
Portland’s flexible warehouse market serves a diverse base of small businesses, makers, food and beverage producers, and trades. Notably, the usual dynamic has flipped this cycle: small-bay vacancy has more than doubled, meaning the segment that’s normally tight is now offering tenants unusual choice and negotiating room — a real opportunity for smaller users.
Who’s leasing flexible space in Portland: food and beverage producers and distributors, contractors and building trades, e-commerce and last-mile operators, makers and light manufacturers, and semiconductor and tech suppliers in the western corridor.
Browse available co-warehousing and small-bay warehouse listings on WareCRE’s Portland marketplace.
Looking for warehouse space in Portland?
Key Trends to Watch
1. Small-Bay Softness Is the Surprise
In most markets, small-bay space stays tight while big-box loosens. Portland flipped that script in Q1 2026 — sub-50,000 SF vacancy more than doubled, giving smaller tenants rare leverage. It’s a reminder that segment dynamics can diverge from the national pattern. Read more: Small-Bay vs. Big-Box: What the Vacancy Gap Means in 2026.
2. Asking vs. Effective Rents
Portland’s asking rents are up ~7.1% year-over-year even as the market softens — because the real concessions are happening below the sticker. Rising free rent, TI, and sublease competition mean effective rents tell the true story. For broader context: Industrial Real Estate Trends & Outlook 2026.
3. The Silicon Forest and Gateway Trade
Portland’s semiconductor cluster and Port of Portland access give it demand drivers beyond commodity logistics. As reshoring and tariff policy reshape chip and manufacturing supply chains, the Hillsboro corridor is a relative bright spot. See: How Tariffs Are Reshaping Warehouse Demand in 2026.
Outlook: What to Watch in Q2–Q3 2026
Portland enters mid-2026 tenant-favorable, with the path to balance running through a slowing supply pipeline.
Expect vacancy to stay elevated near term as recent deliveries and sublease space lease up, then stabilize as the spec pipeline thins through 2026–2027.
Asking rents should hold roughly flat, with the real movement in concessions. New Class A product will keep outperforming; older and sublease space will compete on effective rate.
The biggest opportunity is for tenants — including small-bay users — to lock in space and concessions now, while leverage is at a 15-year high and before the slowing pipeline begins to rebalance the market.
Find warehouse space in Portland
Browse co-warehousing, small-bay, and distribution listings across the Portland metro.
Data sources: Kidder Mathews Portland Industrial Q1 2026, CBRE Portland Industrial Figures Q1 2026, Cushman & Wakefield and JLL Q1 2026, The Registry PS (April 2026), Cresa Portland (2026), WareCRE marketplace data (May 2026).
Related Resources
Frequently Asked Questions
What is the current industrial vacancy rate in Portland?
Portland industrial vacancy rose to about 6.5% in Q1 2026 (availability ~10.9%) — 15-year highs — driven by recent deliveries and elevated sublease space. Net absorption was negative at roughly −872,000 SF.
How much does warehouse space cost in Portland?
Rents are quoted monthly NNN and sit in the mid-$0.80s to low-$0.90s/SF per month (roughly $10–$11/SF annually), with asking rates up about 7.1% year-over-year. Newly delivered assets achieve above $1.00/SF, but rising concessions mean effective rents are softer than asking.
Is Portland a good market for warehouse tenants right now?
Yes — it’s one of the strongest tenant’s markets in years, with vacancy at 15-year highs and rising concessions. Unusually, that includes small-bay space (under 50,000 SF), where vacancy more than doubled, giving smaller tenants rare leverage.
Which Portland submarket is best for warehouse space?
The Northeast/Columbia Corridor has the deepest distribution inventory and drives activity. Rivergate/North Portland serves port-driven big-box. The Sunset Corridor/Hillsboro is the more resilient Silicon Forest submarket, and the I-5 south corridor and Clark County offer value pricing.