Boston Industrial & Warehouse Market Report | Q3 2026
Last updated: November 11, 2026
Key Takeaways
- Boston’s industrial vacancy fell 30 basis points to 11.8% in Q3 2026, its first decline since Q4 2022, though it remains 100 bps higher than a year earlier, according to Cushman & Wakefield.
- Leasing reached 5.6 million SF through Q3, up 72.8% year over year and already 558,000 SF above the full-year 2025 total, with 12 leases above 100,000 SF.
- Direct asking rents rose 9.6% on the year to a record $16.15/SF/yr. The overall asking rent was $15.85/SF/yr NNN.
- Completions reached 2.4 million SF this year, led by Home Depot’s 604,800 SF build-to-suit, and only 1.3 million SF remains under construction.
Browse warehouse space for rent in Boston
11.8%
Overall Vacancy (Q3 2026)
$15.85
Avg. Asking Rent ($/SF/yr NNN)
1.2M
SF Net Absorption (Q3 2026)
1.3M
SF Under Construction
Boston’s industrial market turned a corner in Q3 2026. Vacancy fell for the first time since late 2022, to 11.8%, as move-ins outpaced departures and leasing ran well ahead of last year. Rents are up on the year despite the high vacancy, only 1.3 million SF remains under construction, and the West is still the market’s tightest cluster.
Figures are from Cushman & Wakefield’s Q3 2026 Boston Industrial MarketBeat unless noted. The market covers 186.1 million SF across greater Boston and Worcester. Prior-quarter figures are as restated in C&W’s Q3 2026 U.S. Industrial MarketBeat tables. Rents are weighted net asking rents in $/SF/yr; C&W’s record $16.15 figure is the direct asking rent, which excludes sublease space.
Market Snapshot: Q3 2026
| Metric | Q3 2026 | Q2 2026 (restated) | Change or note |
|---|---|---|---|
| Overall vacancy | 11.8% | 12.1% | Down 30 bps QoQ; up 100 bps YoY |
| Overall asking rent ($/SF/yr NNN) | $15.85 | $15.89 | Up 7.2% YoY (from $14.79) |
| Direct asking rent | $16.15 | n/a | Record high; up 9.6% YoY |
| Warehouse/distribution asking rent | $15.05 | n/a | Manufacturing $16.06 |
| Net absorption | 1,249,572 SF | −548,800 SF | 266,302 SF year to date |
| Leasing activity | 1.2M SF | n/a | 5.6M SF year to date, up 72.8% YoY |
| Completions, year to date | 2,406,350 SF | n/a | Led by Home Depot’s 604,800 SF |
| Under construction | 1,254,609 SF | n/a | Eight assets; one due by year-end |
| Inventory | 186.1M SF | n/a | Greater Boston and Worcester |
Source: Cushman & Wakefield, Boston Industrial MarketBeat Q3 2026; Q2 2026 vacancy, rent and absorption and Q3 2025 rent from C&W’s U.S. Industrial MarketBeat Q3 2026 tables. Year-over-year rent change is a WareCRE calculation. n/a = not restated.
Seventeen industrial properties totaling 1.8 million SF traded in Q3. The largest was LaSalle Investment Management’s $90.3 million purchase of the 396,375 SF warehouse at 80 Pine Hill Drive in Worcester from NorthBridge, about $228 per SF. Berkeley Partners paid $82.5 million, about $359 per SF, for 300 Riverpark Drive in the 128 North submarket.
Rent Trends: Record Direct Rents Despite High Vacancy
The overall asking rent was $15.85/SF/yr NNN in Q3 2026, against $15.89 in Q2 as restated and $14.79 a year earlier, a 7.2% annual increase (WareCRE calculation). C&W’s direct asking rent, which excludes sublease space, reached a record $16.15, up 9.6% on the year, and every cluster posted annual growth.
The North led the increase, with all three of its submarkets up more than $1.00. Asking rents in the North rose $3.76 to $20.39, nearly $4.25 above the market average. By product type, warehouse/distribution space asks $15.05/SF/yr and manufacturing $16.06 (C&W national table).
For Tenants
Vacancy is high but falling, and landlords have raised rents over the year, so expect less room to negotiate as 2027 approaches. The 495 South submarket, at 17.9% vacancy and $12.68/SF/yr, has the most space and some of the lowest rents. The West is tightest: 495 West is 8.8% vacant and Worcester 3.8%. Search Boston warehouse listings on WareCRE
Construction Pipeline: 1.3M SF Underway
Eight assets totaling 1.3 million SF were under construction at the end of Q3 2026. Only one is expected to deliver before year-end: a speculative 180,000 SF warehouse at 40 United Drive. 495 South holds the largest share of the pipeline, at 697,287 SF, followed by 495 North at 375,800 SF.
Completions reached 2.4 million SF through Q3. The largest was Home Depot’s 604,800 SF build-to-suit at 65 Theodore Drive in Worcester, which delivered in Q3. 495 South added 956,588 SF this year and Urban North 481,387 SF.
For Owners
With leasing up sharply and only 1.3 million SF under construction, vacancy, which reached 12.1% in Q2, has started to come down. The North and South clusters, where vacancy rose at least 100 bps over the year, will take longest. Owners in the West, below 10% vacancy, are best placed to push rents.
Submarket Breakdown
| Submarket | Inventory | Vacancy | Asking rent ($/SF/yr) | Under construction |
|---|---|---|---|---|
| 495 South | 41.5M SF | 17.9% | $12.68 | 697,287 SF |
| 495 North | 39.8M SF | 10.5% | $15.73 | 375,800 SF |
| 495 West | 38.6M SF | 8.8% | $13.38 | 0 SF |
| 128 South | 23.2M SF | 10.2% | $18.08 | 0 SF |
| 128 North | 18.9M SF | 11.4% | $16.26 | 181,522 SF |
| Worcester | 7.0M SF | 3.8% | $10.12 | 0 SF |
| Urban North | 5.4M SF | 18.4% | $38.62 | 0 SF |
| Urban South | 5.4M SF | 9.9% | $22.49 | 0 SF |
| Boston total | 186.1M SF | 11.8% | $15.85 | 1,254,609 SF |
Source: Cushman & Wakefield, Boston Industrial MarketBeat Q3 2026. Smaller submarkets (128 Central, Framingham/Natick, Urban West) are included in the total.
495 West and Worcester
The West is the market’s tightest cluster, at 8.1% vacancy and the only one below 10%, after a 190 bps improvement over the year. 495 West led Q3 absorption with 1,132,179 SF, and Worcester added 627,692 SF as Home Depot’s new facility opened. Worcester is the lowest-cost submarket at $10.12/SF/yr.
495 North and 128 North
The North led rent growth this year and asks nearly $4.25 above the market average. 495 North, 39.8 million SF, is 10.5% vacant and asks $15.73/SF/yr; BlueTriton Brands’ 500,000 SF renewal at 66 Saratoga Boulevard there was the market’s largest renewal in more than a year, and Amazon took 206,000 SF at 175 Lowell Street. Urban North asks $38.62, the market’s highest rent, at 18.4% vacancy.
495 South and 128 South
495 South is the market’s largest submarket and the loosest of the large ones, at 17.9% vacancy, after 956,588 SF of completions this year. It also has the most space under construction. 128 South is 10.2% vacant and asks $18.08/SF/yr.
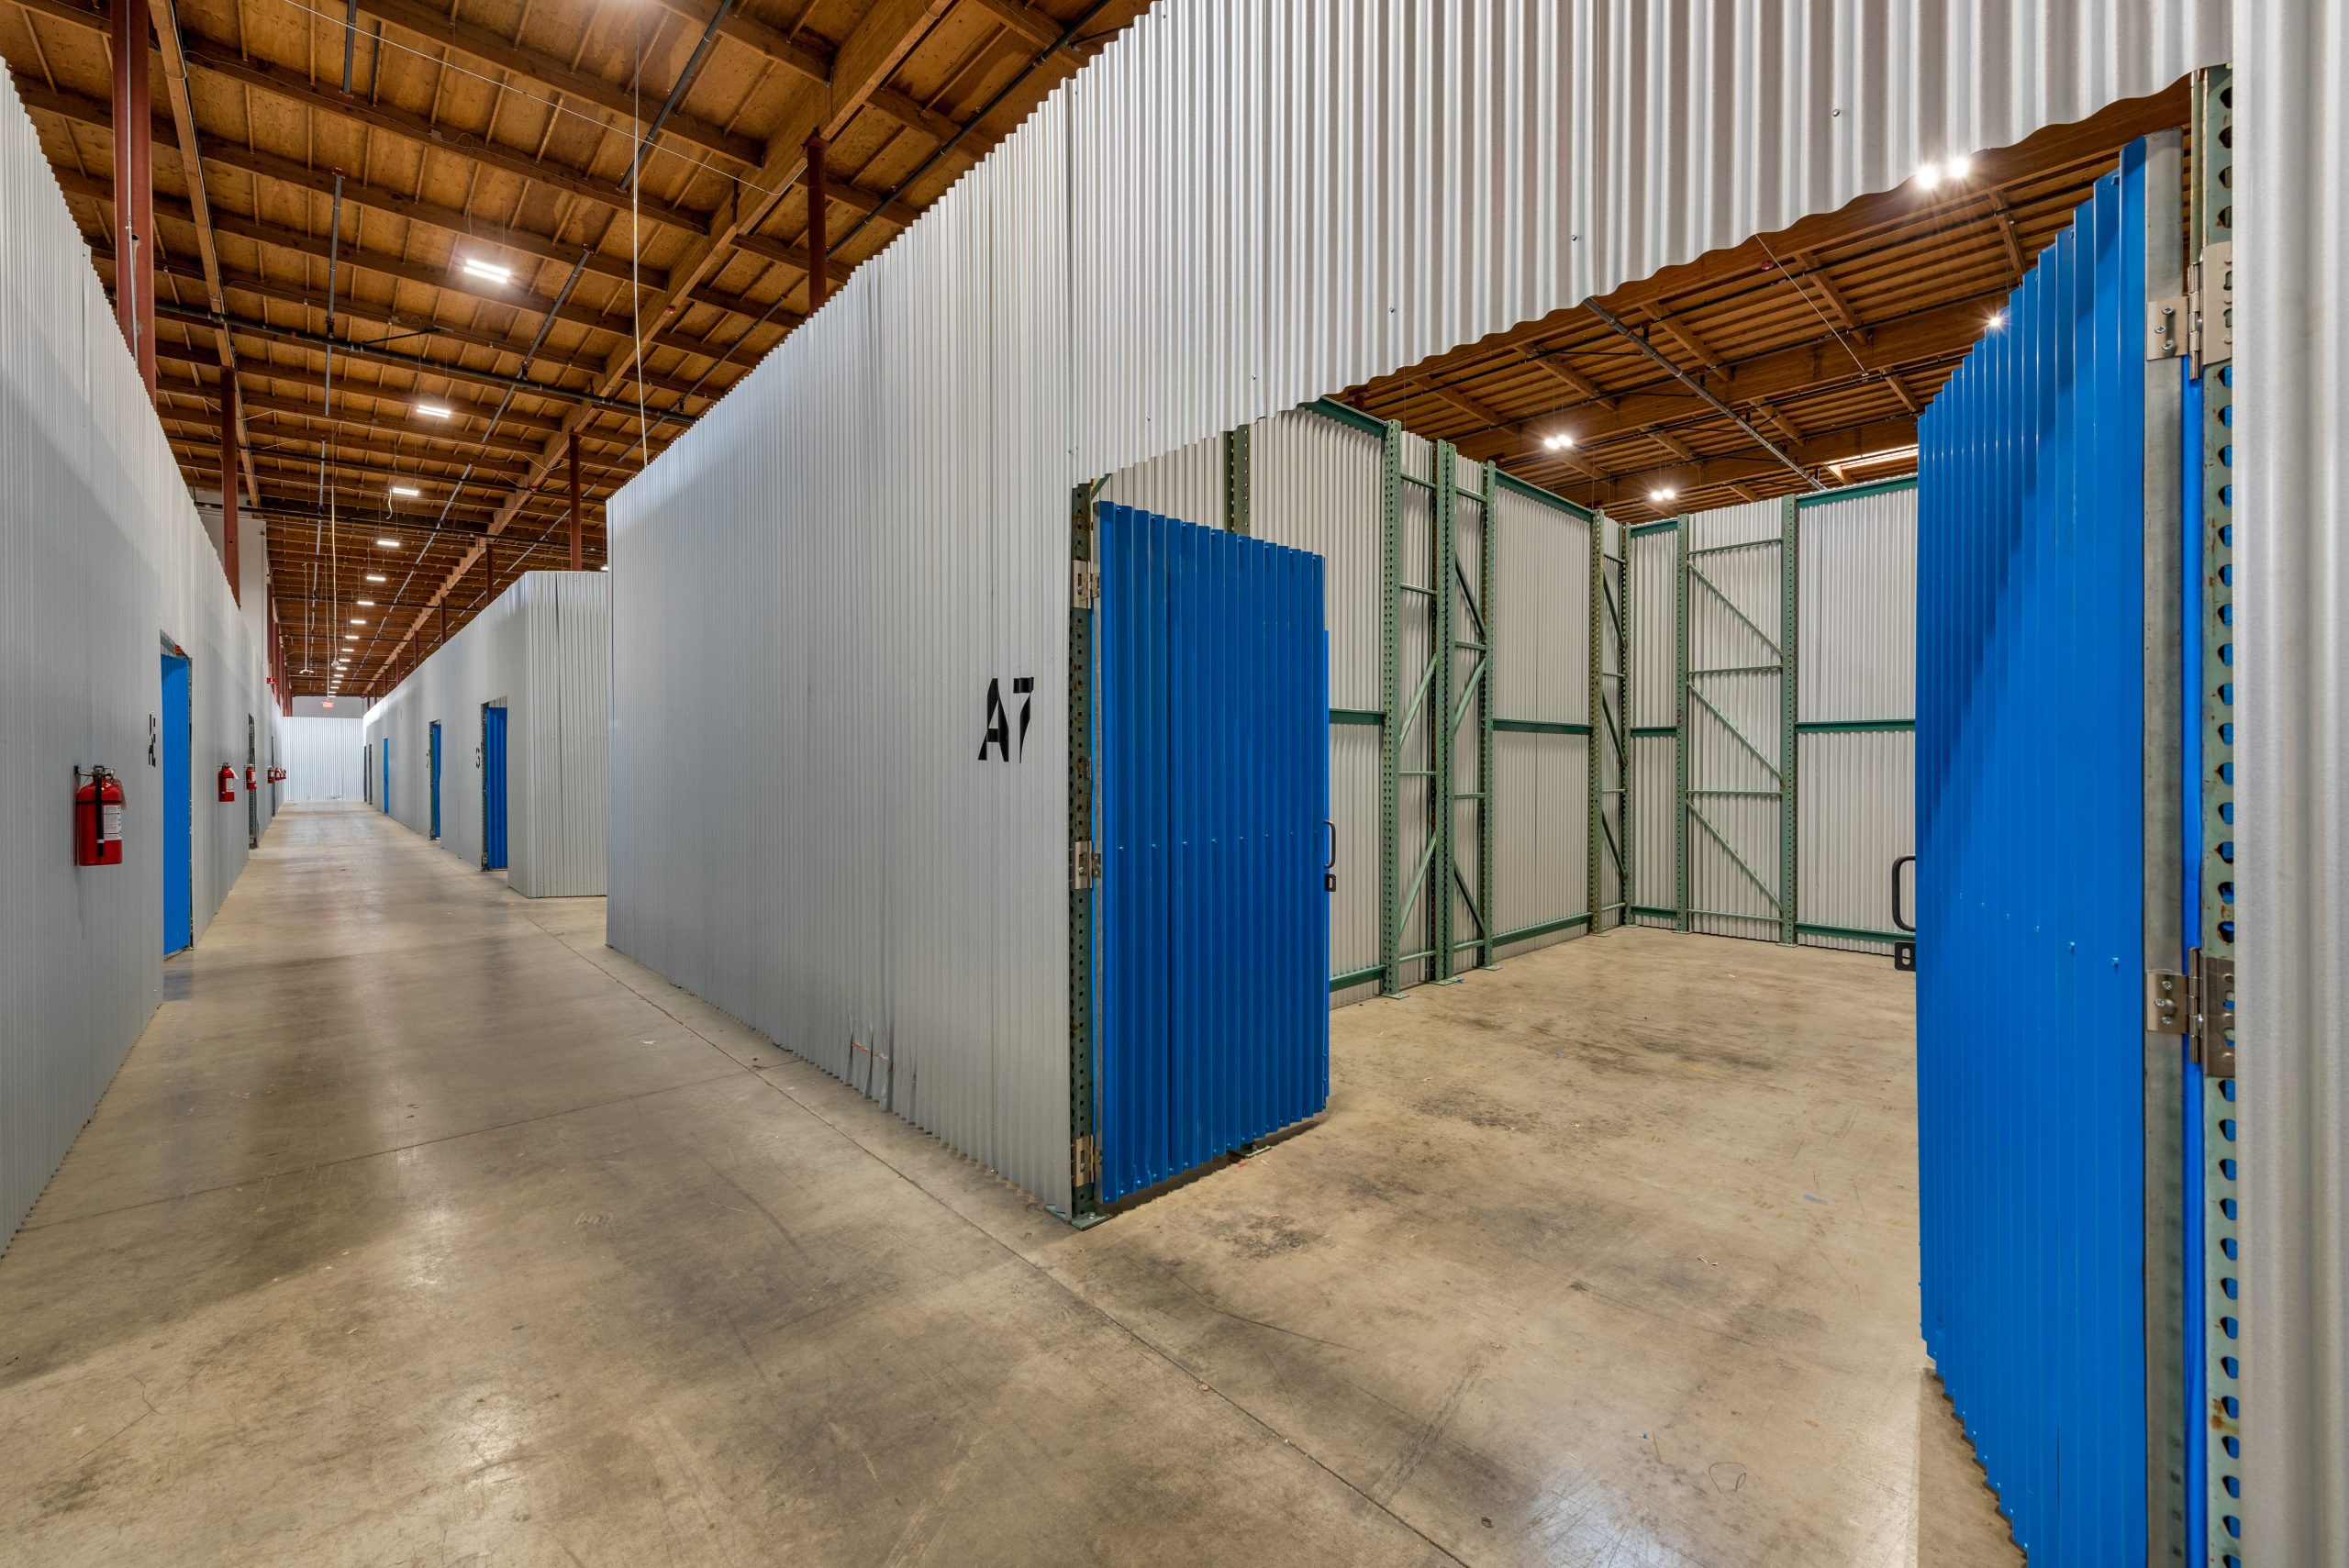
Small-Bay and Flex Space in Boston
C&W’s Boston report does not break out small-bay or flex space. Its rents show a wide gap between the inner urban submarkets, where Urban North asks $38.62 and Urban South $22.49, and the outer 495 and Worcester markets at $10 to $16. For small-format users, the choice is between proximity to customers and lower occupancy cost.
For how small-bay space is defined and priced nationally, see our small bay industrial guide.
Looking for warehouse space in Boston?
Browse Boston ListingsKey Trends to Watch
1. Large-Block Demand Has Returned
Twelve leases above 100,000 SF were signed through Q3, more than double the five recorded through Q3 2025. Move-ins outpaced departures in Q3, generating 1.4 million SF of positive direct absorption, the highest quarterly total since Q4 2022, with three tenants occupying spaces of 450,000 SF or more contributing.
2. Rents Are Up on the Year
Direct asking rents have risen 9.6% over the year to a record, with growth in every cluster, even though vacancy is still near 12%.
3. The Pipeline Is Thin
With 1.3 million SF under construction and only one building due before year-end, new supply will add little vacancy in the near term. That leaves leasing as the main driver of where vacancy goes in 2027.
Outlook: What to Watch in Early 2027
C&W’s year-end 2026 MarketBeats are typically released in January. Three measures will show whether Boston’s recovery holds.
- A second quarterly vacancy decline. Q3 was the first quarterly decline since Q4 2022; another drop would confirm the turn.
- The North and South clusters. Both saw vacancy rise at least 100 bps over the year. Improvement there would broaden the recovery beyond the West.
- 40 United Drive. The 180,000 SF speculative warehouse is the only delivery expected before year-end.
Find warehouse space in Boston
Browse small-bay, flex and distribution listings across greater Boston and Worcester.
Search Boston ListingsRelated Resources
Frequently Asked Questions
What is the current industrial vacancy rate in Boston?
Boston’s industrial vacancy rate was 11.8% in Q3 2026, down 30 basis points from Q2 and the first decline since Q4 2022, but 100 basis points higher than a year earlier, according to Cushman & Wakefield. The West cluster is tightest at 8.1%.
How much does warehouse space cost in Boston?
The overall average asking rent was $15.85 per square foot per year NNN in Q3 2026, and the direct asking rent reached a record $16.15, up 9.6% on the year. Warehouse/distribution space asks $15.05. Rents range from $10.12 in Worcester to $38.62 in Urban North.
Which Boston submarket has the most available space?
495 South has the most available space, about 7.4 million SF, and a 17.9% vacancy rate, the highest among the large submarkets; Urban North is 18.4% vacant. Worcester, at 3.8%, and 495 West, at 8.8%, are the tightest large submarkets, according to Cushman & Wakefield’s Q3 2026 report.
How much industrial space is under construction in Boston?
Eight assets totaling 1.3 million SF were under construction at the end of Q3 2026, with only a 180,000 SF speculative warehouse at 40 United Drive expected before year-end. Completions through Q3 reached 2.4 million SF, led by Home Depot’s 604,800 SF build-to-suit in Worcester.
Is Boston industrial leasing picking up?
Yes. Leasing reached 5.6 million SF through Q3 2026, up 72.8% year over year and already above the full-year 2025 total. Twelve leases above 100,000 SF were signed, compared with five through Q3 2025, and renewals reached 1.6 million SF in Q3.
Sources: Cushman & Wakefield, Boston Industrial MarketBeat Q3 2026; Cushman & Wakefield, U.S. Industrial MarketBeat Q3 2026 (restated quarterly tables). Each report reflects the most recent vacancy, rental, and construction data available at the time of publication.