New York City Industrial & Warehouse Market Report | Q3 2026
Key Takeaways
- New York City industrial vacancy fell 30 basis points to 6.8% in Q3 2026, ending four straight quarterly increases. The figures cover the 139.6 million SF Outer Boroughs market (the Bronx, Brooklyn, Queens and Staten Island).
- The average asking rent eased $0.18 to $27.31/SF/yr net. Cushman & Wakefield says pricing is still trending down from its Q4 2024 peak, though Bronx rents rose 3.5%.
- Net absorption turned positive at +343,266 SF after two quarters of losses, and new leasing rose 137.3% on the quarter to 1.0 million SF. Queens accounted for 63.2% of it.
- 737,027 SF is under construction across three sites, most of it in Brooklyn. Outside the city, Northern New Jersey vacancy fell to 7.9% and Long Island rose to 5.3% (separate C&W reports).
Browse warehouse space for rent in New York City
6.8%
Overall Vacancy (Q3 2026)
$27.31
Avg. Asking Rent ($/SF/yr net)
+343K
SF Net Absorption (Q3 2026)
737K
SF Under Construction
New York City’s industrial market turned a corner in Q3 2026. Vacancy fell to 6.8%, tenants absorbed 343,266 SF on net, and new leasing more than doubled from Q2. Queens drove the rebound, while asking rents slipped for another quarter everywhere except the Bronx.
This report covers New York City as Cushman & Wakefield defines it in its Q3 2026 NY Outer Boroughs Industrial MarketBeat: the Bronx, Brooklyn, Queens and Staten Island, 139.6 million SF in total. Manhattan is not part of that report. Figures are from that report unless noted, and prior-quarter comparisons use the figures as restated in C&W’s U.S. Industrial MarketBeat Q3 2026 metro tables, which match the changes the local report states. Rents are weighted net asking rents in $/SF/yr. Northern New Jersey and Long Island appear further down as separate, labelled sections based on C&W’s own reports for those markets. Their figures are not combined with the city’s.
Market Snapshot: Q3 2026
| Metric | Q3 2026 | Q2 2026 (restated) | YoY or note |
|---|---|---|---|
| Overall vacancy | 6.8% | 7.1% | −30 bps QoQ; +50 bps YoY; ends a four-quarter rise |
| Overall asking rent ($/SF/yr net) | $27.31 | $27.49 | −$0.18 QoQ; −$0.37 YoY (from $27.68) |
| Warehouse/distribution asking rent ($/SF/yr net) | $28.04 | $28.10 | −$0.06 QoQ |
| Net absorption | +343,266 SF | −598,887 SF | −269,687 SF year to date; Q2 was first published at −620,030 SF |
| Leasing activity | 1.0M SF | n/a | +137.3% QoQ; 2.2M SF year to date |
| Deliveries (new construction) | 366,264 SF year to date | 366,264 SF year to date | 331,700 SF of it on Staten Island |
| Under construction | 737,027 SF | 737,027 SF | Three sites; about 0.5% of inventory |
| Inventory | 139.6M SF | 139.9M SF | 1,869 buildings in four boroughs |
Source: Cushman & Wakefield, NY Outer Boroughs Industrial MarketBeat Q3 2026. Q2 2026 vacancy, rent and absorption and Q3 2025 figures as restated in C&W’s U.S. Industrial MarketBeat Q3 2026 metro tables; Q2 warehouse/distribution rent follows from the change C&W states; Q2 deliveries, pipeline and inventory from the Q2 2026 report.
Rent Trends: Asking Rents Slip to $27.31/SF as the Bronx Climbs
The overall average asking rent fell $0.18 in Q3 to $27.31/SF/yr net. C&W says pricing has continued to trend down from its Q4 2024 peak. Warehouse/distribution space asks $28.04/SF/yr, down $0.06 on the quarter.
Borough averages spread widely. The Bronx asks $33.93/SF/yr after a 3.5% quarterly gain, the only borough where rents rose. Queens asks $28.77, Brooklyn $25.15 and Staten Island $20.63, all in $/SF/yr net. Brooklyn’s warehouse/distribution space averages $27.68/SF/yr, above the borough’s overall figure.
For Tenants
Leverage is narrowing in the best space. Queens vacancy fell 50 bps to 6.1% as large blocks leased, and new Class A buildings such as the Review Avenue Complex are finding tenants. Staten Island has the highest vacancy rate, at 18.6%, and Brooklyn is the tightest borough at 5.2%. Rents are still drifting down, so tenants in older space have room to negotiate. Search New York City warehouse listings on WareCRE.
Construction Pipeline: 737,027 SF Underway, Mostly in Brooklyn
C&W counts 737,027 SF under construction across three sites, with 637,027 SF in Brooklyn and 100,000 SF in the Bronx. Nothing is under way in Queens or on Staten Island. The pipeline equals about 0.5% of the four boroughs’ inventory (WareCRE calculation).
Year-to-date completions total 366,264 SF, unchanged from Q2. Of that, 331,700 SF delivered on Staten Island, which also has the highest vacancy of the four boroughs at 18.6%.
For Operators
Demand has turned positive, but the recovery is uneven. Net absorption was +343,266 SF in Q3, the first gain after two quarters of losses, while year-to-date absorption is still −269,687 SF. C&W expects stronger leasing of new construction and a slower pipeline to help absorb existing vacant Class A inventory, which has generally been slow to attract tenants. The Bronx remains the strongest borough, with rents up 3.5% in Q3.
Submarket Breakdown
C&W reports the city’s industrial market by borough. Queens and Brooklyn hold most of the inventory; the Bronx and Staten Island are smaller and moved in opposite directions this quarter.
Queens
Queens is the largest borough market at 57.3 million SF. Vacancy fell 50 bps to 6.1% as several large blocks leased, and Queens absorbed 288,254 SF in Q3, the most of any borough, though it is still −348,808 SF year to date. It accounted for 63.2% of the quarter’s leasing and four of its five largest deals. A confidential e-commerce company leased the entire 245,337 SF Whitestone Logistics Center in College Point, the largest lease of the year, and four leases totaling 350,000 SF were signed at the new Review Avenue Complex in Long Island City. The overall asking rent is $28.77/SF/yr net, and warehouse/distribution space asks $28.87. Nothing is under construction.
Brooklyn
Brooklyn has 54.3 million SF and is the tightest borough at 5.2% vacancy. It absorbed 11,967 SF in Q3, leaving year-to-date absorption at −261,476 SF. The overall asking rent is $25.15/SF/yr net, with warehouse/distribution space at $27.68. Brooklyn holds 637,027 SF of the city’s 737,027 SF pipeline. Terreno Realty bought 659 Court Street (36,600 SF) from LBA Realty for $26.3M, or $717/SF.
The Bronx
The Bronx has 20.2 million SF at 8.2% vacancy, and its net absorption of +300,916 SF year to date is the best of any borough. The Bronx has the highest asking rent in the city at $33.93/SF/yr net, up 3.5% in Q3, the only borough where rents rose. 100,000 SF is under construction. F&F Supply bought 1275 Oak Point Avenue (50,000 SF) from Manhattan Beer Distributors for $21.6M, or $432/SF.
Staten Island
Staten Island is the smallest market at 7.9 million SF and has the highest vacancy, 18.6%, after 331,700 SF of new construction delivered this year. It is also the lowest-cost borough at $20.63/SF/yr net. It gave back 8,900 SF in Q3, and net absorption is +39,681 SF year to date.
| Borough | Inventory | Vacancy | Overall Rent ($/SF/yr net) | YTD Net Absorption | Under Construction |
|---|---|---|---|---|---|
| Queens | 57.3M SF | 6.1% | $28.77 | −348,808 SF | 0 SF |
| Brooklyn | 54.3M SF | 5.2% | $25.15 | −261,476 SF | 637,027 SF |
| The Bronx | 20.2M SF | 8.2% | $33.93 | +300,916 SF | 100,000 SF |
| Staten Island | 7.9M SF | 18.6% | $20.63 | +39,681 SF | 0 SF |
| Outer Boroughs total | 139.6M SF | 6.8% | $27.31 | −269,687 SF | 737,027 SF |
Source: Cushman & Wakefield, NY Outer Boroughs Industrial MarketBeat Q3 2026.
Beyond the City: Northern New Jersey and Long Island
Many New York City occupiers also look across the Hudson or east on Long Island. C&W covers both in separate reports, summarized here. These markets use their own inventories and are not blended into the city figures above.
Northern New Jersey (C&W New Jersey Industrial MarketBeat Q3 2026)
Northern New Jersey has 317.1 million SF of industrial space. Vacancy fell to 7.9% from a restated 8.2% in Q2. Net absorption was +1,322,102 SF in Q3 and +3,816,166 SF year to date, and 2,169,759 SF is under construction. Warehouse/distribution space asks $17.43/SF/yr net. The Meadowlands, one of Northern NJ’s largest submarkets at 82.1 million SF, absorbed 346,325 SF in Q3 and 1,861,368 SF year to date, at 7.7% vacancy and $17.91/SF/yr for warehouse space. Statewide, C&W reported a third consecutive quarter of occupancy gains, with 4.8 million SF absorbed, the strongest quarter of 2026. Central New Jersey, a separate 386.3 million SF market, fell to 8.3% vacancy from a restated 9.0% after absorbing 3,438,618 SF and asks $15.73/SF/yr for warehouse space. It holds 6,278,499 SF of the state’s pipeline, and its Exit 8A submarket is at 9.3% vacancy and $15.30.
Long Island (C&W Long Island Industrial MarketBeat Q3 2026)
Long Island has 136.7 million SF. Vacancy rose 40 bps to 5.3%, and the average asking rent fell $0.41 to $18.90/SF/yr net, with declines in both counties. Net absorption was −520,215 SF in Q3 and −202,423 SF year to date, which C&W attributes mainly to eight newly available spaces over 50,000 SF. Leasing still reached 4.0 million SF year to date, already above 2025’s full-year total. 2.1 million SF is under construction across five sites, including Ares Management’s new 332,920 SF speculative logistics center in Medford. Nassau County runs 4.8% vacancy at $20.95/SF/yr; Suffolk County 5.5% at $18.08.
| Market (separate C&W report) | Inventory | Vacancy | Rent ($/SF/yr net) | Q3 Net Absorption | Under Construction |
|---|---|---|---|---|---|
| Northern New Jersey | 317.1M SF | 7.9% | $17.43 (W/D) | +1,322,102 SF | 2,169,759 SF |
| Central New Jersey | 386.3M SF | 8.3% | $15.73 (W/D) | +3,438,618 SF | 6,278,499 SF |
| Long Island | 136.7M SF | 5.3% | $18.90 (overall) | −520,215 SF | 2,068,538 SF |
Sources: Cushman & Wakefield, New Jersey Industrial MarketBeat Q3 2026 and Long Island Industrial MarketBeat Q3 2026. Rents are weighted net asking, $/SF/yr.
Co-Warehousing & Flexible Warehouse Space in New York City
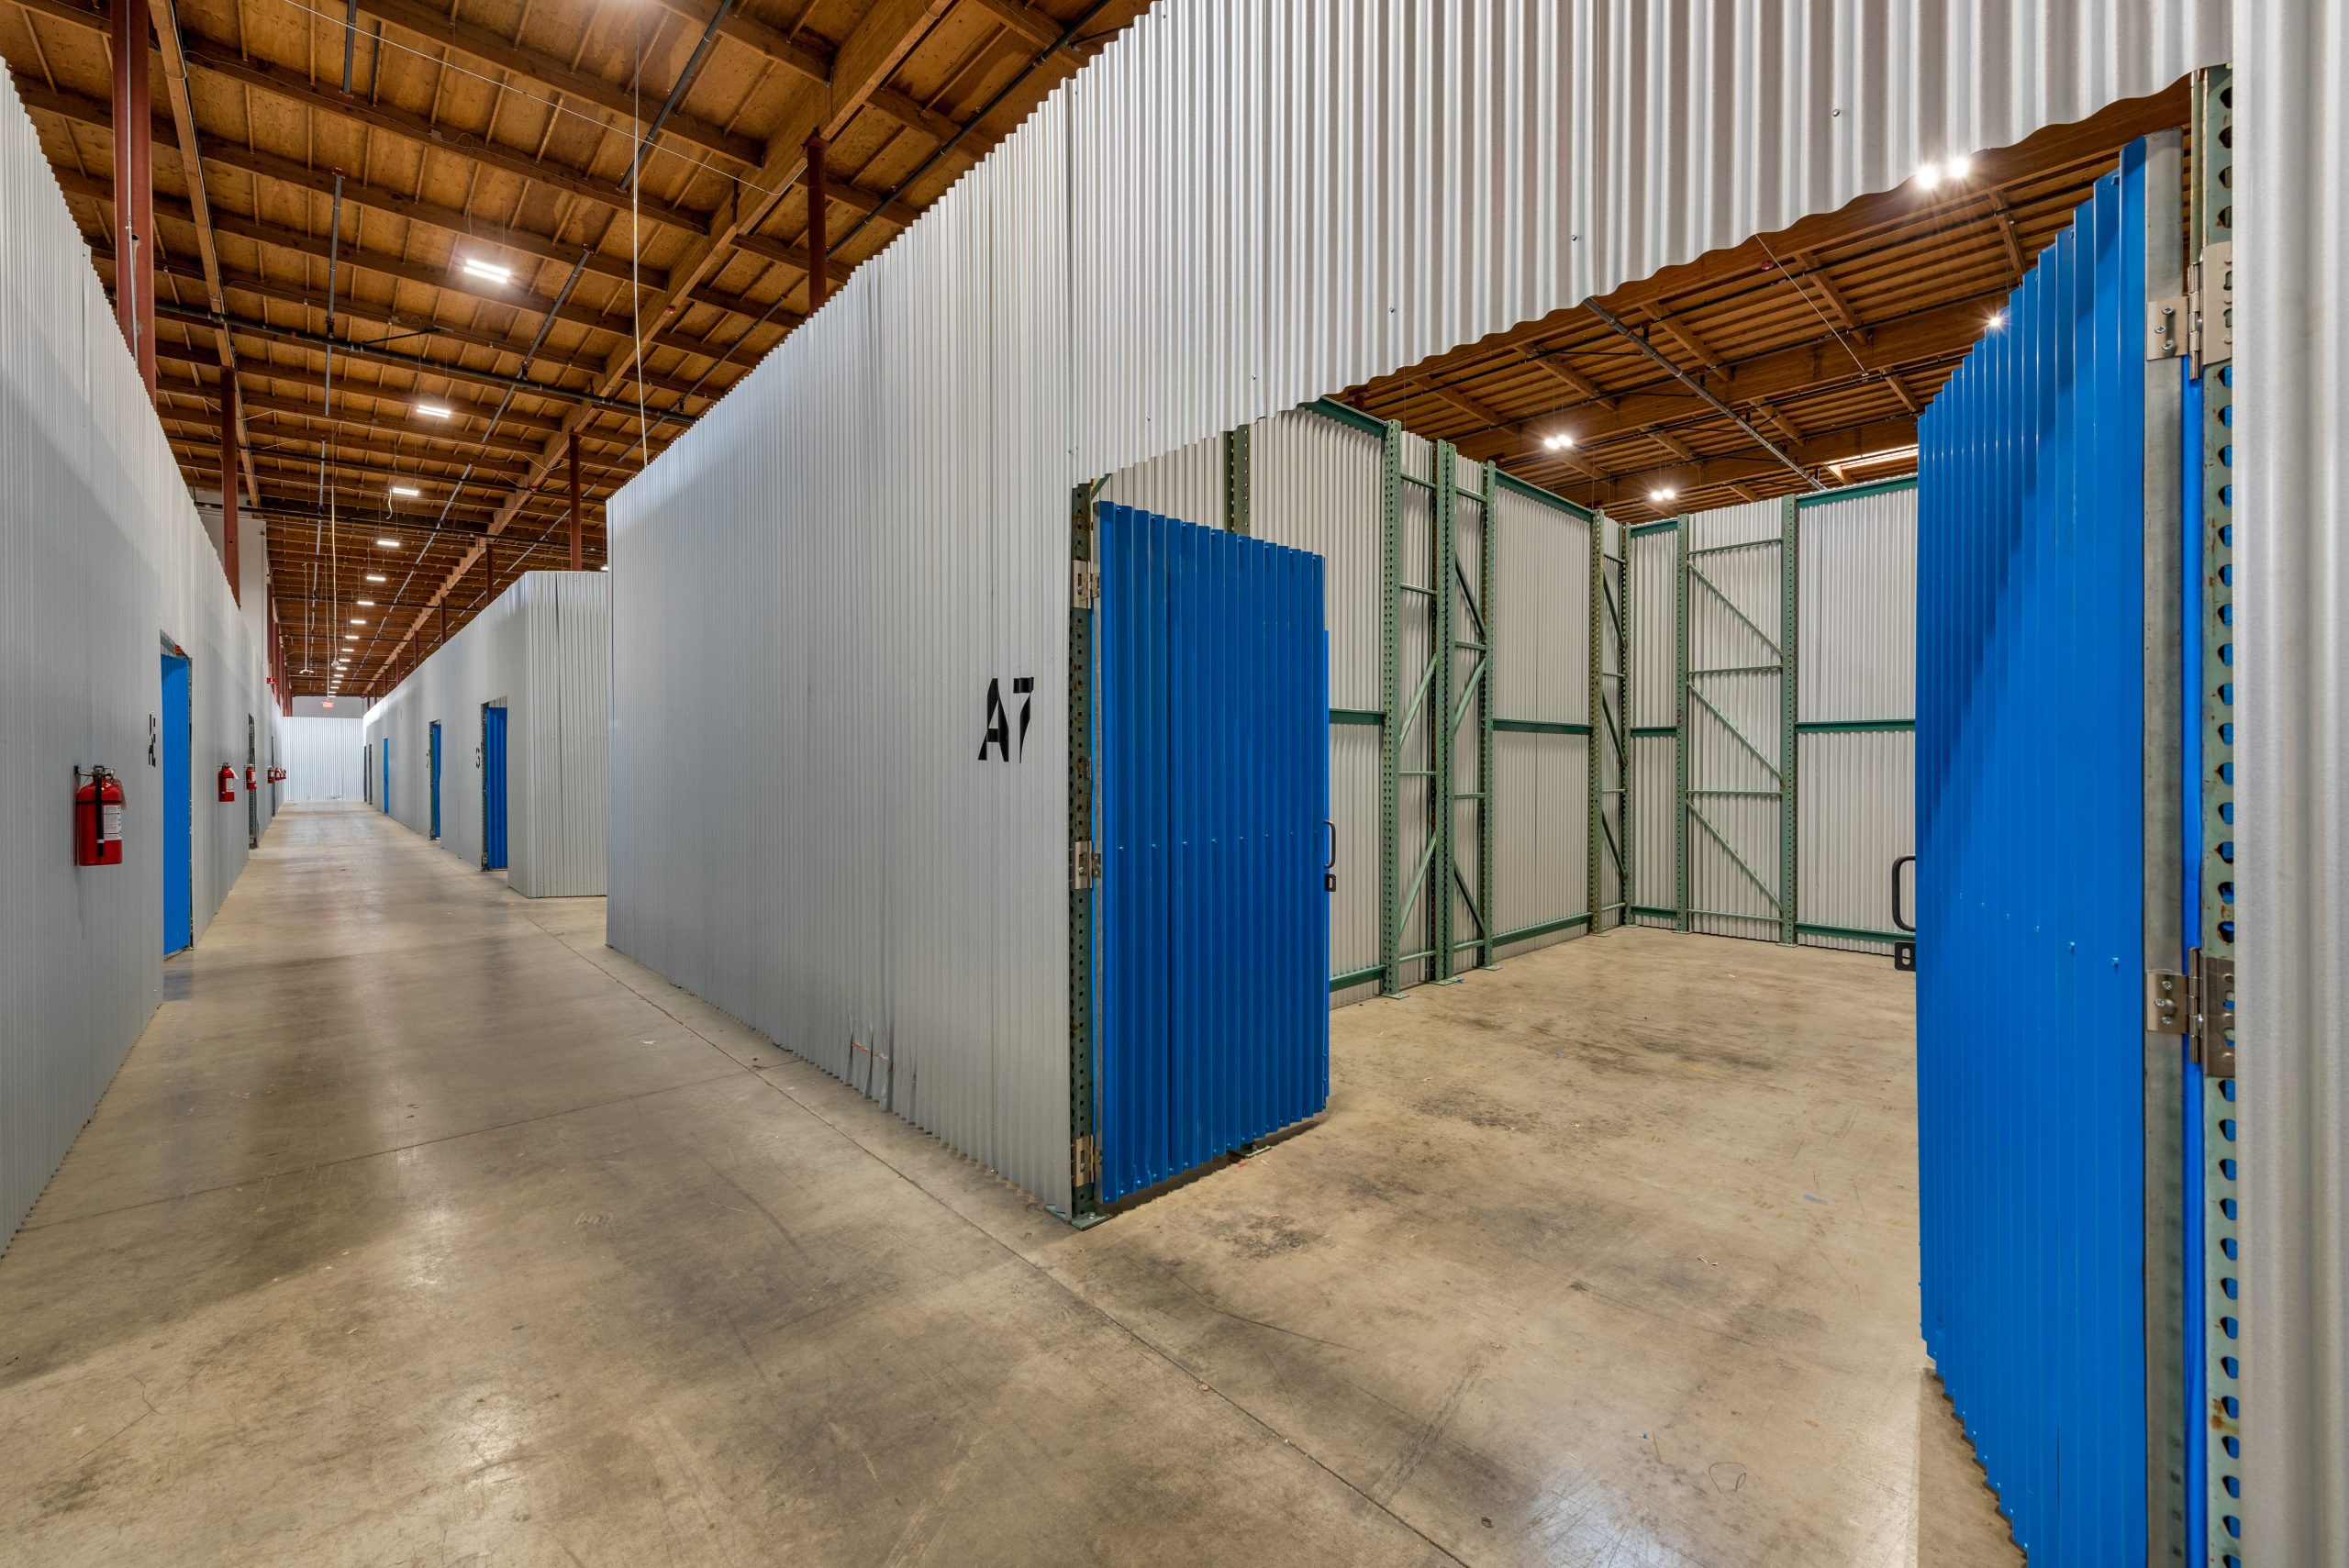
Flexible warehouse space in New York is scarce and expensive. The boroughs have little developable industrial land, so small-bay and flex space near consumers stays in steady demand. For small businesses that need a foothold near the urban core, flexible space is often the only practical option.
Most flexible-space users in New York City are last-mile and e-commerce operators serving city consumers. Contractors and building trades, food, beverage and specialty distributors, and importers using the Port of New York and New Jersey also lease it. So do growing businesses that want room to scale without a long-term commitment.
Browse available co-warehousing and small-bay warehouse listings on WareCRE’s New York City marketplace.
Looking for warehouse space in New York City?
Key Trends to Watch
1. Vacancy Snapped a Four-Quarter Rise
Outer Boroughs vacancy fell 30 bps to 6.8% in Q3, ending four straight quarterly increases, and net absorption turned positive at 343,266 SF. New leasing rose 137.3% on the quarter to 1.0 million SF, bringing year-to-date deal volume to 2.2 million SF. For context on how small and large spaces are diverging nationally, see Small-Bay vs. Big-Box: What the Vacancy Gap Means for Tenants and Operators.
2. Queens Led the Rebound
Queens accounted for 63.2% of Q3 leasing and absorbed 288,254 SF, and its vacancy fell to 6.1%. The largest lease of the year, a confidential e-commerce company’s 245,337 SF at Whitestone Logistics Center, was signed there, along with 350,000 SF across four leases at the Review Avenue Complex. C&W also notes strong demand for industrial outdoor storage, with 11 acres of parking leased across the boroughs in Q3.
3. Northern New Jersey Absorbed Space as Long Island Paused
Northern New Jersey absorbed 1,322,102 SF in Q3 and its vacancy fell to 7.9%, part of a third straight quarter of statewide occupancy gains. Long Island went the other way, with vacancy up to 5.3% and −520,215 SF of absorption as large spaces came available, although its leasing has already passed 2025’s full-year total. For how trade policy is affecting port-linked warehouse demand, see How Tariffs Are Reshaping Warehouse Demand in 2026.
Outlook: What to Watch in Early 2027
C&W’s year-end 2026 MarketBeats are expected in mid-January. Three measures will show whether the recovery holds.
Watch whether vacancy keeps falling. Q3’s 6.8% ended four straight increases. A second decline would confirm that the Queens leasing was more than a one-quarter rebound.
Watch whether rents stabilize. Asking rents have eased from their Q4 2024 peak to $27.31/SF/yr. Gains beyond the Bronx would signal that the decline is ending.
Watch new Class A space. C&W expects stronger leasing of new construction and a slower pipeline to help absorb vacant Class A inventory. More deals like those at the Review Avenue Complex would show that process is under way.
Find warehouse space in New York City
Browse co-warehousing, small-bay, and distribution listings across New York City.
Data sources: Cushman & Wakefield NY Outer Boroughs Industrial MarketBeat Q3 2026 (headline and borough figures; rents weighted net asking, $/SF/yr) and Q2 2026; Cushman & Wakefield New Jersey Industrial MarketBeat Q3 2026 (Northern and Central New Jersey); Cushman & Wakefield Long Island Industrial MarketBeat Q3 2026; Cushman & Wakefield U.S. Industrial MarketBeat Q3 2026 (restated Q2 figures). Each report reflects the most recent vacancy, rental, and construction data available at the time of publication. We refresh our reports as new market data is released, and we’re continually expanding coverage to additional metros.
Related Resources
Frequently Asked Questions
What is the current industrial vacancy rate in New York City?
Industrial vacancy in New York City’s Outer Boroughs (the Bronx, Brooklyn, Queens and Staten Island) was 6.8% in Q3 2026, according to Cushman & Wakefield, down 30 basis points from Q2 and the first decline after four straight quarterly increases. Brooklyn was the tightest borough at 5.2%; Staten Island had the highest vacancy at 18.6%.
How much does warehouse space cost in New York City?
The overall average asking rent was $27.31/SF/yr net in Q3 2026, down $0.18 from Q2. Warehouse/distribution space averaged $28.04/SF/yr. By borough, overall asking rents were $33.93 in the Bronx, $28.77 in Queens, $25.15 in Brooklyn and $20.63 on Staten Island, all in $/SF/yr net.
Which New York City borough is best for warehouse space?
It depends on the requirement. Brooklyn is the tightest borough at 5.2% vacancy and holds most of the pipeline. Queens is the largest market at 57.3 million SF and led Q3 leasing, with vacancy down to 6.1%. The Bronx asks the highest rent at $33.93/SF/yr and has the strongest year-to-date absorption. Staten Island is the lowest-cost option at $20.63/SF/yr, with 18.6% vacancy.
How much industrial space is under construction in New York City?
737,027 SF was under construction in the Outer Boroughs at the end of Q3 2026, across three sites in Brooklyn (637,027 SF) and the Bronx (100,000 SF). Year-to-date completions totaled 366,264 SF. In separate C&W reports, Central New Jersey had 6,278,499 SF under construction and Long Island 2,068,538 SF.