Des Moines Industrial & Warehouse Market Report | Q2 2026
Key Takeaways
- Des Moines recorded 651,503 SF of net absorption in Q2 2026, according to Cushman & Wakefield’s preliminary national figures. That was its strongest quarter in the past year and more than triple the Q1 total.
- C&W’s preliminary vacancy held at 7.6%, unchanged from Q1 but 200 basis points higher than a year earlier. CBRE, on its own basis, shows a sharper improvement, with vacancy falling from 8.6% to 7.5%.
- The average asking rent was $7.24/SF/yr NNN, up 2.5% on the year and about 30% below the U.S. average of $10.32/SF/yr.
- 1.6 million SF is under construction, about 2.0% of inventory. C&W’s local team expects conditions to tighten through 2026 as large occupiers absorb available speculative space.
Browse warehouse space for rent in Des Moines
7.6%
Overall Vacancy (Q2 2026)
$7.24
Avg. Asking Rent ($/SF/yr NNN)
651.5K
SF Net Absorption (Q2 2026)
1.6M
SF Under Construction
Demand for Des Moines industrial space picked up sharply in Q2 2026. Net absorption of 651,503 SF was the highest of the five quarters in C&W’s national tables and followed two negative quarters in the second half of 2025. C&W’s preliminary vacancy rate held at 7.6% as new space delivered alongside that demand. Asking rents were steady at $7.24/SF/yr. The metro sits at the I-80 and I-35 interchange, and its rents are about 30% below the U.S. average.
Cushman & Wakefield has not yet published a local Q2 2026 Des Moines MarketBeat. Metro totals on this page are from C&W’s Q2 2026 U.S. Industrial MarketBeat tables, where Q2 figures are marked preliminary. Rents in those tables are NNN, quoted in $/SF/yr. Submarket detail comes from C&W’s latest local report, the Q1 2026 Des Moines Industrial MarketBeat, which uses a different local dataset. C&W notes that its local statistics do not align with the nationally published data. CBRE figures appear only as labelled cross-checks.
Market Snapshot: Q2 2026
| Metric | Q2 2026 (preliminary) | Q1 2026 (restated) | YoY or note |
|---|---|---|---|
| Overall vacancy | 7.6% | 7.6% | ↑200 bps YoY (5.6% in Q2 2025) |
| Overall asking rent ($/SF/yr NNN) | $7.24 | $7.26 | +2.5% YoY (from $7.06) |
| Warehouse/distribution asking rent ($/SF/yr NNN) | $6.70 | n/a | Manufacturing rent not published |
| Net absorption | 651,503 SF | 210,248 SF | 861,751 SF year to date |
| Leasing activity | 592,622 SF | n/a | Excludes renewals |
| Deliveries | 359,217 SF year to date | n/a | Quarter-only figure not published |
| Under construction | 1.6M SF | n/a | About 2.0% of inventory |
| Inventory | 78.0M SF | n/a | U.S. vacancy 6.9%; U.S. rent $10.32/SF/yr NNN |
Source: Cushman & Wakefield, U.S. Industrial MarketBeat Q2 2026, Des Moines metro rows (Q2 2026 preliminary; Q1 2026 and Q2 2025 as restated). Year-to-date absorption is the sum of the Q1 and Q2 figures. n/a = not published for that quarter in the Q2 tables.
Rent Trends: Steady at $7.24/SF, Up 2.5% on the Year
The average asking rent was $7.24/SF/yr NNN in Q2 2026, compared with $7.26 in Q1 and $7.06 a year earlier. Warehouse/distribution space asks $6.70/SF/yr. The U.S. average in the same C&W release is $10.32/SF/yr, so Des Moines asks about 30% less. CBRE puts the Q2 average asking rent at $6.62/SF on its own basis.
Rents differ by product and location. In C&W’s local Q1 2026 report, warehouse/distribution space asked $6.82/SF/yr, office/service industrial space $10.27, and new construction $11.06. Warehouse rents ranged from $5.41/SF/yr in Ankeny to $7.30 in the Western Suburbs.
For Tenants
Tenants still have options, but the window is narrowing. At 7.6%, vacancy is above the U.S. rate of 6.9%, and rents are flat quarter over quarter. Absorption is rising, and C&W’s local team expects large occupiers to take up the available speculative space through 2026. Big-box users should look at the Northeast and Western Suburbs, which had the most vacant space in Q1. Newly built space asks a premium. Search Des Moines warehouse listings on WareCRE.
Construction Pipeline: 1.6M SF Underway
C&W’s Q2 national tables show 1.6 million SF under construction in Des Moines, about 2.0% of the 78.0 million SF inventory. Year-to-date deliveries total 359,217 SF. In its Q1 local report, C&W described the 1.16 million SF then underway as the highest pipeline since late 2022. The Northeast held the most construction in Q1, 645,645 SF.
CBRE reports a smaller pipeline on its own basis, with 937,000 SF under construction across 14 projects at the end of Q2 and 257,000 SF of new deliveries in the quarter.
For Operators
Demand is improving, but vacancy has not yet turned down in C&W’s figures, and 1.6 million SF of new supply is on the way. Owners of older warehouse space should expect competition from new buildings, which ask $11.06/SF/yr in C&W’s local Q1 figures. The Q2 absorption total suggests the speculative space delivered over the past year is starting to lease.
Submarket Breakdown
C&W’s local report divides Des Moines into six submarkets. The figures below are from the Q1 2026 local MarketBeat, the latest available. That report’s metro vacancy was 8.1%, compared with 7.6% in C&W’s national tables, because the two use different datasets. The four largest submarkets hold most of the inventory.
Northeast (Altoona, Bondurant)
The largest submarket at 29.1 million SF, with direct access to the I-80/I-35 interchange. Vacancy was 8.6% in Q1 and warehouse space asked $6.45/SF/yr. It recorded negative absorption of 249,130 SF, driven by a 265,200 SF move-out at Altus Commerce in Altoona. It also had the 270,000 SF Baker Group lease in Altoona that C&W says anchored Q1 leasing, and the most space under construction, 645,645 SF.
Western Suburbs (West Des Moines, Waukee)
A 25.0 million SF submarket that led Q1 absorption with 315,141 SF. Vacancy was 9.2%, the highest of the four largest submarkets, and warehouse space asked $7.30/SF/yr, the highest in the metro. It delivered 215,344 SF of new construction in Q1.
Northwest
A 9.6 million SF submarket with 6.3% vacancy and warehouse rents of $6.52/SF/yr. It posted negative absorption of 113,621 SF in Q1 and had 210,998 SF under construction.
South
A 7.8 million SF submarket with 6.6% vacancy and warehouse rents of $6.61/SF/yr. It absorbed 85,098 SF in Q1 and had 120,601 SF under construction.
| Submarket (Q1 2026) | Vacancy | W/D Asking Rent ($/SF/yr) | YTD Net Absorption (SF) | Under Construction (SF) |
|---|---|---|---|---|
| Northeast | 8.6% | $6.45 | -249,130 | 645,645 |
| Western Suburbs | 9.2% | $7.30 | 315,141 | 191,220 |
| Northwest | 6.3% | $6.52 | -113,621 | 210,998 |
| South | 6.6% | $6.61 | 85,098 | 120,601 |
| Ankeny | 3.7% | $5.41 | 7,849 | 0 |
| CBD | 9.6% | $6.99 | 3,052 | 0 |
| Des Moines total (local basis) | 8.1% | $6.82 | 48,389 | 1,168,464 |
Source: Cushman & Wakefield Alliance, Des Moines Industrial MarketBeat Q1 2026, market statistics table. Rents are base asking rates per year. C&W notes that these local statistics do not align with the nationally published data used for the metro totals above.
Co-Warehousing & Flexible Warehouse Space in Des Moines
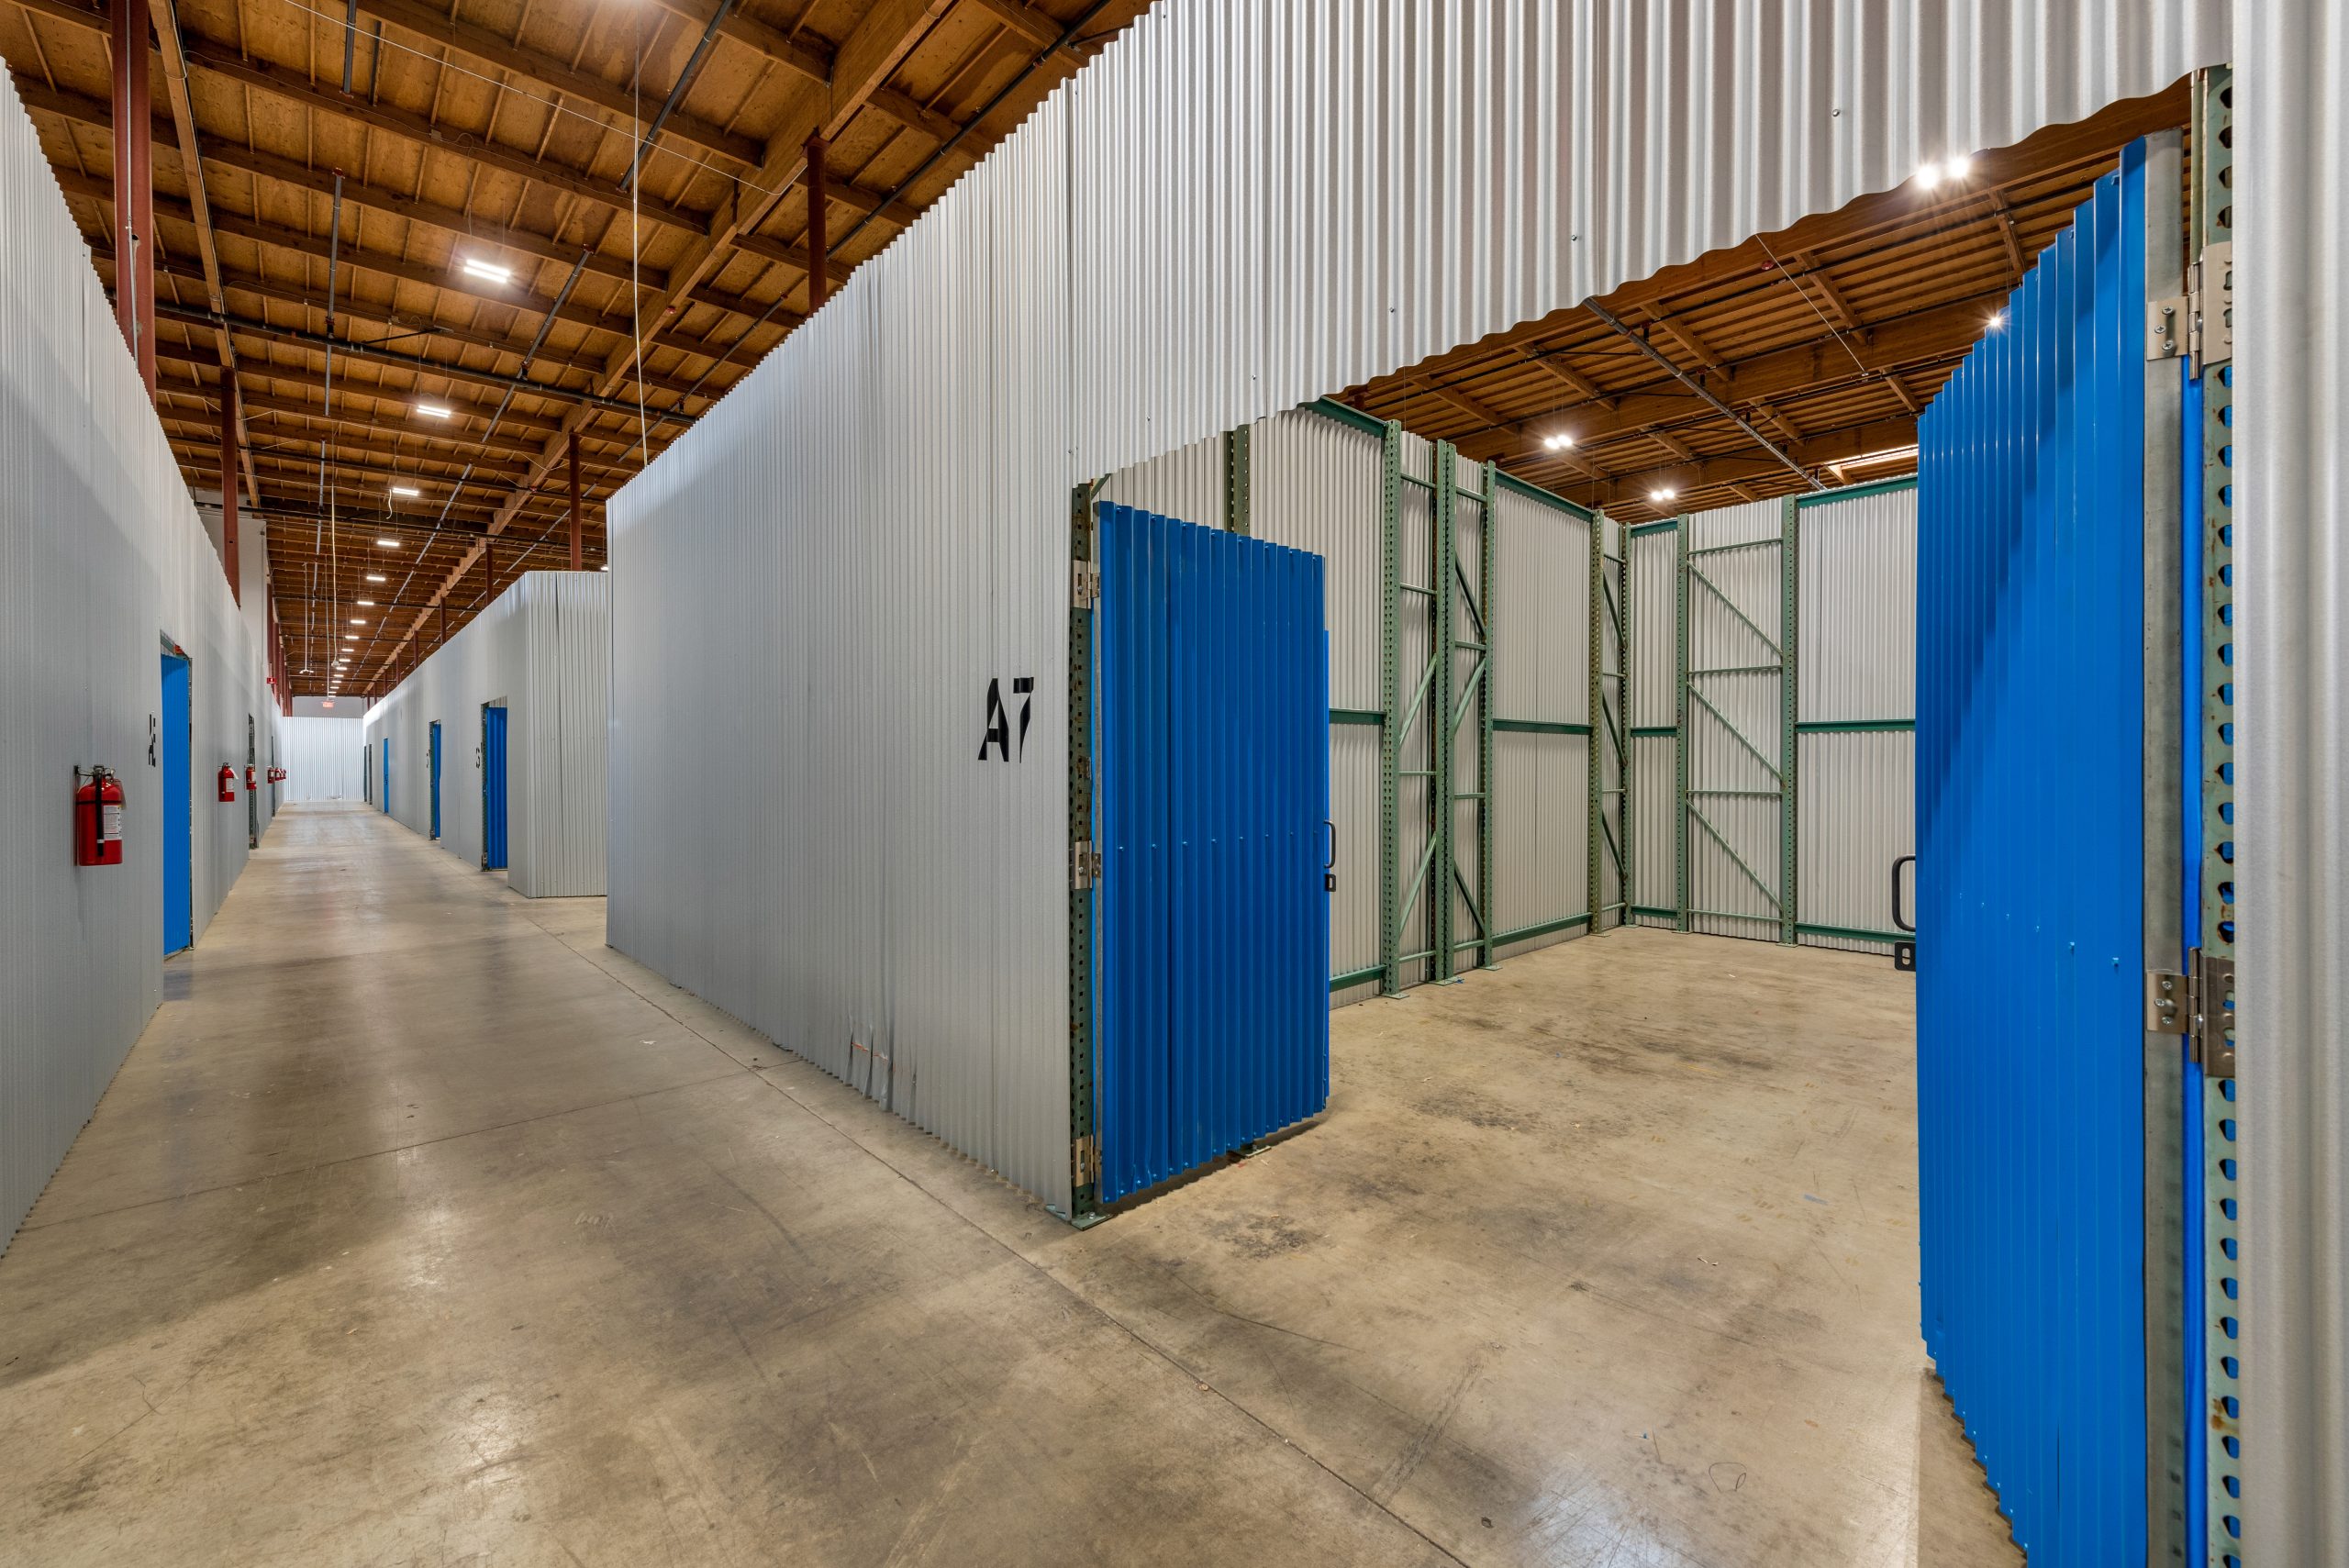
Flex space in Des Moines asks far more than standard warehouse space. In C&W’s local Q1 2026 report, office/service industrial space, the category that includes most flex product, asked $10.27/SF/yr, against $6.82 for warehouse/distribution space.
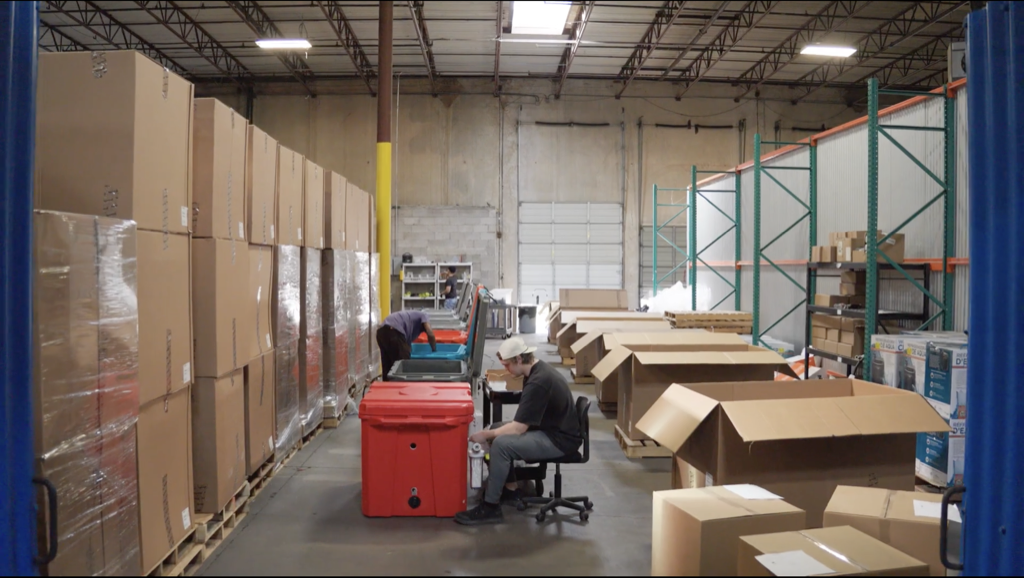
Flexible-space users in Des Moines range from e-commerce businesses using the metro’s central location to agricultural technology and ag-processing companies. Insurance and financial services firms take space for records storage and fulfillment, as do construction trades and food producers and distributors.
Browse available co-warehousing and small-bay warehouse listings on WareCRE’s Des Moines marketplace.
Looking for warehouse space in Des Moines?
Key Trends to Watch
1. Absorption Turned Sharply Positive in Q2
After losing 986,438 SF of occupancy in Q3 2025 and 280,722 SF in Q4, Des Moines absorbed 210,248 SF in Q1 and 651,503 SF in Q2 in C&W’s national figures. CBRE shows the same turn on its own basis, with 982,000 SF of Q2 absorption and vacancy down 110 basis points. For broader context: Industrial Real Estate Trends & Outlook 2026.
2. Vacancy Is Still Well Above Where It Was a Year Ago
Even with stronger demand, C&W’s vacancy rate is 7.6%, up from 5.6% in Q2 2025, after two quarters of negative absorption in the second half of 2025. C&W’s local team expects conditions to tighten through 2026 as large occupiers absorb that space. The next two quarters will show how quickly that happens. Read more: Small-Bay vs. Big-Box: What the Vacancy Gap Means in 2026.
3. Data Centers Are Competing for Industrial Land
C&W reports that Des Moines’ emergence as a data center hub accelerated in Q1, when the City of Norwalk approved a $12 billion, 282-acre data center project by Denver-based Tract. Tract also acquired 453 acres in Altoona in 2025. Large land purchases like these can limit sites for future warehouse development in the same corridors.
Outlook: What to Watch in Q4 2026
C&W’s Q3 2026 MarketBeats are due in mid-October, with the year-end release to follow. For Des Moines, also watch for an updated local C&W report, since the latest local figures date from Q1.
Watch whether C&W’s vacancy starts to fall. CBRE already shows a 110 bps drop, and a C&W Q3 rate below 7.6% would put the two sources in line.
Watch whether absorption stays positive. Q2’s 651,503 SF was the best quarter in the past year, and a second strong quarter would show that the speculative space delivered in 2025 is being leased.
Neither the C&W national tables nor the Q1 local report break out preleasing on the 1.6 million SF pipeline. New deliveries that arrive vacant would push vacancy back up.
Find warehouse space in Des Moines
Browse co-warehousing, small-bay, and distribution listings across the Des Moines metro.
Data sources: Cushman & Wakefield U.S. Industrial MarketBeat Q2 2026 (Des Moines metro totals, Q2 2026 preliminary; restated Q1 2026 and earlier quarters; U.S. averages; rents NNN, $/SF/yr); Cushman & Wakefield Alliance Des Moines Industrial MarketBeat Q1 2026 (submarket, product-type and local context figures; rents base asking, $/SF/yr); CBRE Des Moines Industrial Figures Q2 2026 (cross-check only). Each report reflects the most recent vacancy, rental, and construction data available at the time of publication. We refresh our reports as new market data is released, and we’re continually expanding coverage to additional metros.
Related Resources
Frequently Asked Questions
What is the current industrial vacancy rate in Des Moines?
Des Moines industrial vacancy was 7.6% in Q2 2026 in Cushman & Wakefield’s preliminary national figures, unchanged from Q1 and up from 5.6% a year earlier. CBRE, using its own data, puts Q2 vacancy at 7.5%, down from 8.6% in Q1.
How much does warehouse space cost in Des Moines?
The overall average asking rent was $7.24/SF/yr NNN in Q2 2026, up 2.5% year over year, and warehouse/distribution space averaged $6.70/SF/yr. That is about 30% below the U.S. average of $10.32/SF/yr. In C&W’s local Q1 report, office/service industrial space asked $10.27/SF/yr and new construction $11.06.
Which Des Moines submarket is best for warehouse space?
It depends on the requirement. The Northeast, around Altoona and Bondurant, is the largest submarket at 29.1 million SF, with direct I-80/I-35 access and the most construction underway. The Western Suburbs led Q1 absorption and have the highest warehouse rents. Ankeny is the tightest submarket at 3.7% vacancy.
How much industrial space is under construction in Des Moines?
1.6 million SF was under construction at the end of Q2 2026 in Cushman & Wakefield’s national tables, about 2.0% of inventory. CBRE reports 937,000 SF across 14 projects on its own basis. Year-to-date deliveries total 359,217 SF.
What are the Des Moines industrial market trends in 2026?
Demand is recovering after a weak second half of 2025. Net absorption reached 651,503 SF in Q2, the best quarter in the past year, while vacancy held at 7.6% as new speculative space delivered. Rents are steady at $7.24/SF/yr. Data center projects, including Tract’s $12 billion Norwalk campus, are a growing source of land demand.