Orange County Industrial & Warehouse Market Report | Q2 2026
Key Takeaways
- Orange County industrial vacancy rose to 5.2% in Q2 2026, up 20 basis points from Q1 and 100 basis points year over year, but still below the U.S. average of 6.9%.
- Net absorption was negative for a second straight quarter, at negative 362,429 SF, bringing the year-to-date total to negative 1.3 million SF. First-half leasing still rose 5.8% to 4.8 million SF.
- Average asking rent rose 3.0% in the quarter to $1.52/SF/mo NNN, flat year over year. Warehouse/distribution space led the gain; manufacturing rents slipped to $1.37.
- 972,936 SF is under construction across nine buildings, and developers are shifting from speculative projects toward build-to-suit.
Browse warehouse space for rent in Orange County
5.2%
Overall Vacancy (Q2 2026)
$1.52
Avg. Asking Rent ($/SF/mo NNN)
-362K
SF Net Absorption (Q2 2026)
973K
SF Under Construction
Orange County’s industrial market softened again in Q2 2026. Vacancy edged up to 5.2% as move-outs outpaced move-ins for a second quarter, and speculative buildings delivered without pre-leasing. First-half leasing still reached 4.8 million SF, up 5.8% year over year. Rents held up better than occupancy, with the average asking rate rising to $1.52/SF/mo NNN.
Figures are from Cushman & Wakefield’s Q2 2026 Orange County Industrial MarketBeat unless noted. Prior-quarter comparisons use the figures as restated in C&W’s Q2 2026 reports. Rents are triple net (NNN) asking rates, quoted in $/SF per month by Southern California convention; C&W’s national table publishes the same rate as $18.24/SF/yr.
Market Snapshot: Q2 2026
| Metric | Q2 2026 | Q1 2026 (restated) | YoY or note |
|---|---|---|---|
| Overall vacancy | 5.2% | 5.0% | +100 bps YoY (4.2% in Q2 2025) |
| Avg. asking rent ($/SF/mo NNN) | $1.52 | $1.48 | Flat YoY; +3.0% QoQ |
| Net absorption | -362,429 SF | -955,752 SF | -1,318,181 SF year to date |
| New leasing activity | 2.0M SF | 2.8M SF | 4.8M SF year to date, +5.8% YoY |
| Deliveries | 606,308 SF year to date | n/a | Quarter-only figure not published |
| Under construction | 972,936 SF | n/a | 586,614 SF speculative; 386,322 SF build-to-suit |
| Investment sales | $428M | n/a | Average price about $280/SF, −11.3% YoY |
| Industrial cap rate (Matthews/CoStar) | 5.4% | n/a | Different data basis from C&W |
| Inventory | 256.0M SF | n/a | Base for all rates above |
Source: Cushman & Wakefield, Orange County Industrial MarketBeat Q2 2026 (sales data from RCA, $10M+ transactions). Q1 2026 and Q2 2025 values as restated in C&W’s U.S. Industrial MarketBeat Q2 2026 metro tables and the Orange County report. Cap rate: Matthews, Orange County Industrial Market Report Q2 2026, citing CoStar. n/a = not restated in the Q2 reports.
Rent Trends: Up 3.0% in the Quarter, Flat on the Year
Orange County’s average asking rent rose 3.0% in Q2 2026, from $1.48 to $1.52/SF/mo NNN, and was flat year over year. Warehouse/distribution space drove the increase, rising $0.05 (3.3%) in the quarter to $1.52, though it remains 1.6% below a year ago. Manufacturing rents kept softening, down 2.4% in the quarter and 2.6% on the year to $1.37. C&W attributes the split to stronger pricing resilience in warehouse space.
At $18.24/SF/yr in C&W’s national table, Orange County’s average asking rent is about 77% above the U.S. average of $10.32/SF/yr. By submarket, averages run from $1.39 in North County to $1.83 in South County.
For Tenants
Rising vacancy and two quarters of negative absorption give tenants more room to negotiate, especially on warehouse/distribution space, where vacancy is 7.5%. Manufacturing space is much tighter at 2.2% vacancy. Compare total occupancy cost as well as base rent, because NNN leases pass taxes, insurance and maintenance through to the tenant. Learn how NNN, gross, and modified gross leases work. Search Orange County warehouse listings on WareCRE.
Construction Pipeline: 973K SF Underway as Developers Favor Build-to-Suit
At the end of Q2 2026, nine buildings totaling 972,936 SF were under construction in Orange County, 586,614 SF of it speculative and 386,322 SF build-to-suit. The pipeline is concentrated in North County (498,450 SF) and the Greater Airport Area (386,322 SF), with another 88,164 SF in West County. South County has nothing under construction. Completions totaled 606,308 SF in the first half.
C&W reports that developers are shifting away from speculative construction toward build-to-suit projects, seeking greater leasing certainty and more predictable cash flows. Speculative deliveries that arrived without pre-leasing were one of the drivers of this year’s vacancy increase.
For Operators
New supply is limited and moving toward build-to-suit, which caps speculative competition. The near-term pressure is occupancy, with absorption at negative 1.3 million SF year to date and warehouse/distribution vacancy at 7.5%. In North County, three speculative projects in Fullerton and Anaheim totaling about 446,000 SF will compete for the same tenants. Pricing to fill space matters more than holding peak rates.
Submarket Breakdown: North County Absorbs, South County Loses the Most
C&W tracks four Orange County submarkets. C&W does not publish city-level figures, so the Anaheim and Santa Ana coverage below uses the submarket each city sits in, based on the addresses C&W reports.
Anaheim and North County
North County, which includes Anaheim, Fullerton, Brea and Yorba Linda, is the largest submarket at 109.5 million SF. It was the only submarket with positive absorption in Q2, at 216,805 SF, though it remains negative 210,559 SF year to date. Vacancy is 5.1% and the average asking rent is $1.39/SF/mo NNN, the lowest of the four submarkets. North County also has the largest pipeline at 498,450 SF, including two speculative projects in Anaheim, 139,535 SF at 701 E. Ball Rd. and 121,288 SF at 5235 E. Hunter Ave. In Q2, Advantage Mailing renewed 122,601 SF at 1650 N. Kraemer Blvd. in Anaheim.
Santa Ana and the Greater Airport Area
The Greater Airport Area, which includes Santa Ana, Tustin, Fountain Valley and parts of Irvine, is the tightest submarket at 4.3% vacancy, with 70.6 million SF of inventory and an average asking rent of $1.46/SF/mo NNN. Absorption was negative 215,817 SF in Q2. All 386,322 SF under construction here is build-to-suit. Santa Ana was active in C&W’s Q1 2026 report: PureCo USA (134,716 SF) and Cubework.com (112,204 SF) leased space at 500 W. Warner Ave., 600–650 S. Grand Ave. sold for $29.9M ($295/SF), and Anduril’s 313,214 SF South Coast Technology Center was listed under construction. In Q2, Anduril also leased 177,766 SF in Tustin.
West County
West County, including Huntington Beach, has 39.4 million SF at 5.2% vacancy and an average asking rent of $1.54/SF/mo NNN. Absorption was negative 121,201 SF in Q2. Harbor Distributing signed the largest new lease C&W highlights for the quarter, 223,406 SF in Huntington Beach. 88,164 SF is under construction.
South County
South County, which includes parts of Irvine, has the highest rents, at $1.83/SF/mo NNN, and the highest vacancy, at 7.4%. It has absorbed negative 758,491 SF year to date, more than half of the county’s total loss, and has nothing under construction. Kyocera renewed 176,640 SF at 14101 Alton Pkwy. in Irvine, and 9750 Irvine Blvd. sold for $107.0M ($307/SF).
| Submarket | Vacancy | Asking Rent ($/SF/mo NNN) | YTD Net Absorption (SF) | Under Construction (SF) |
|---|---|---|---|---|
| North County (incl. Anaheim) | 5.1% | $1.39 | -210,559 | 498,450 |
| Greater Airport Area (incl. Santa Ana) | 4.3% | $1.46 | -261,707 | 386,322 |
| West County | 5.2% | $1.54 | -87,424 | 88,164 |
| South County | 7.4% | $1.83 | -758,491 | 0 |
| Orange County total | 5.2% | $1.52 | -1,318,181 | 972,936 |
Source: Cushman & Wakefield, Orange County Industrial MarketBeat Q2 2026, market statistics table. Rents are overall weighted NNN asking rates, all product types. City-to-submarket placement is based on property addresses in C&W’s Q1 and Q2 2026 Orange County reports.
Co-Warehousing & Flexible Warehouse Space in Orange County
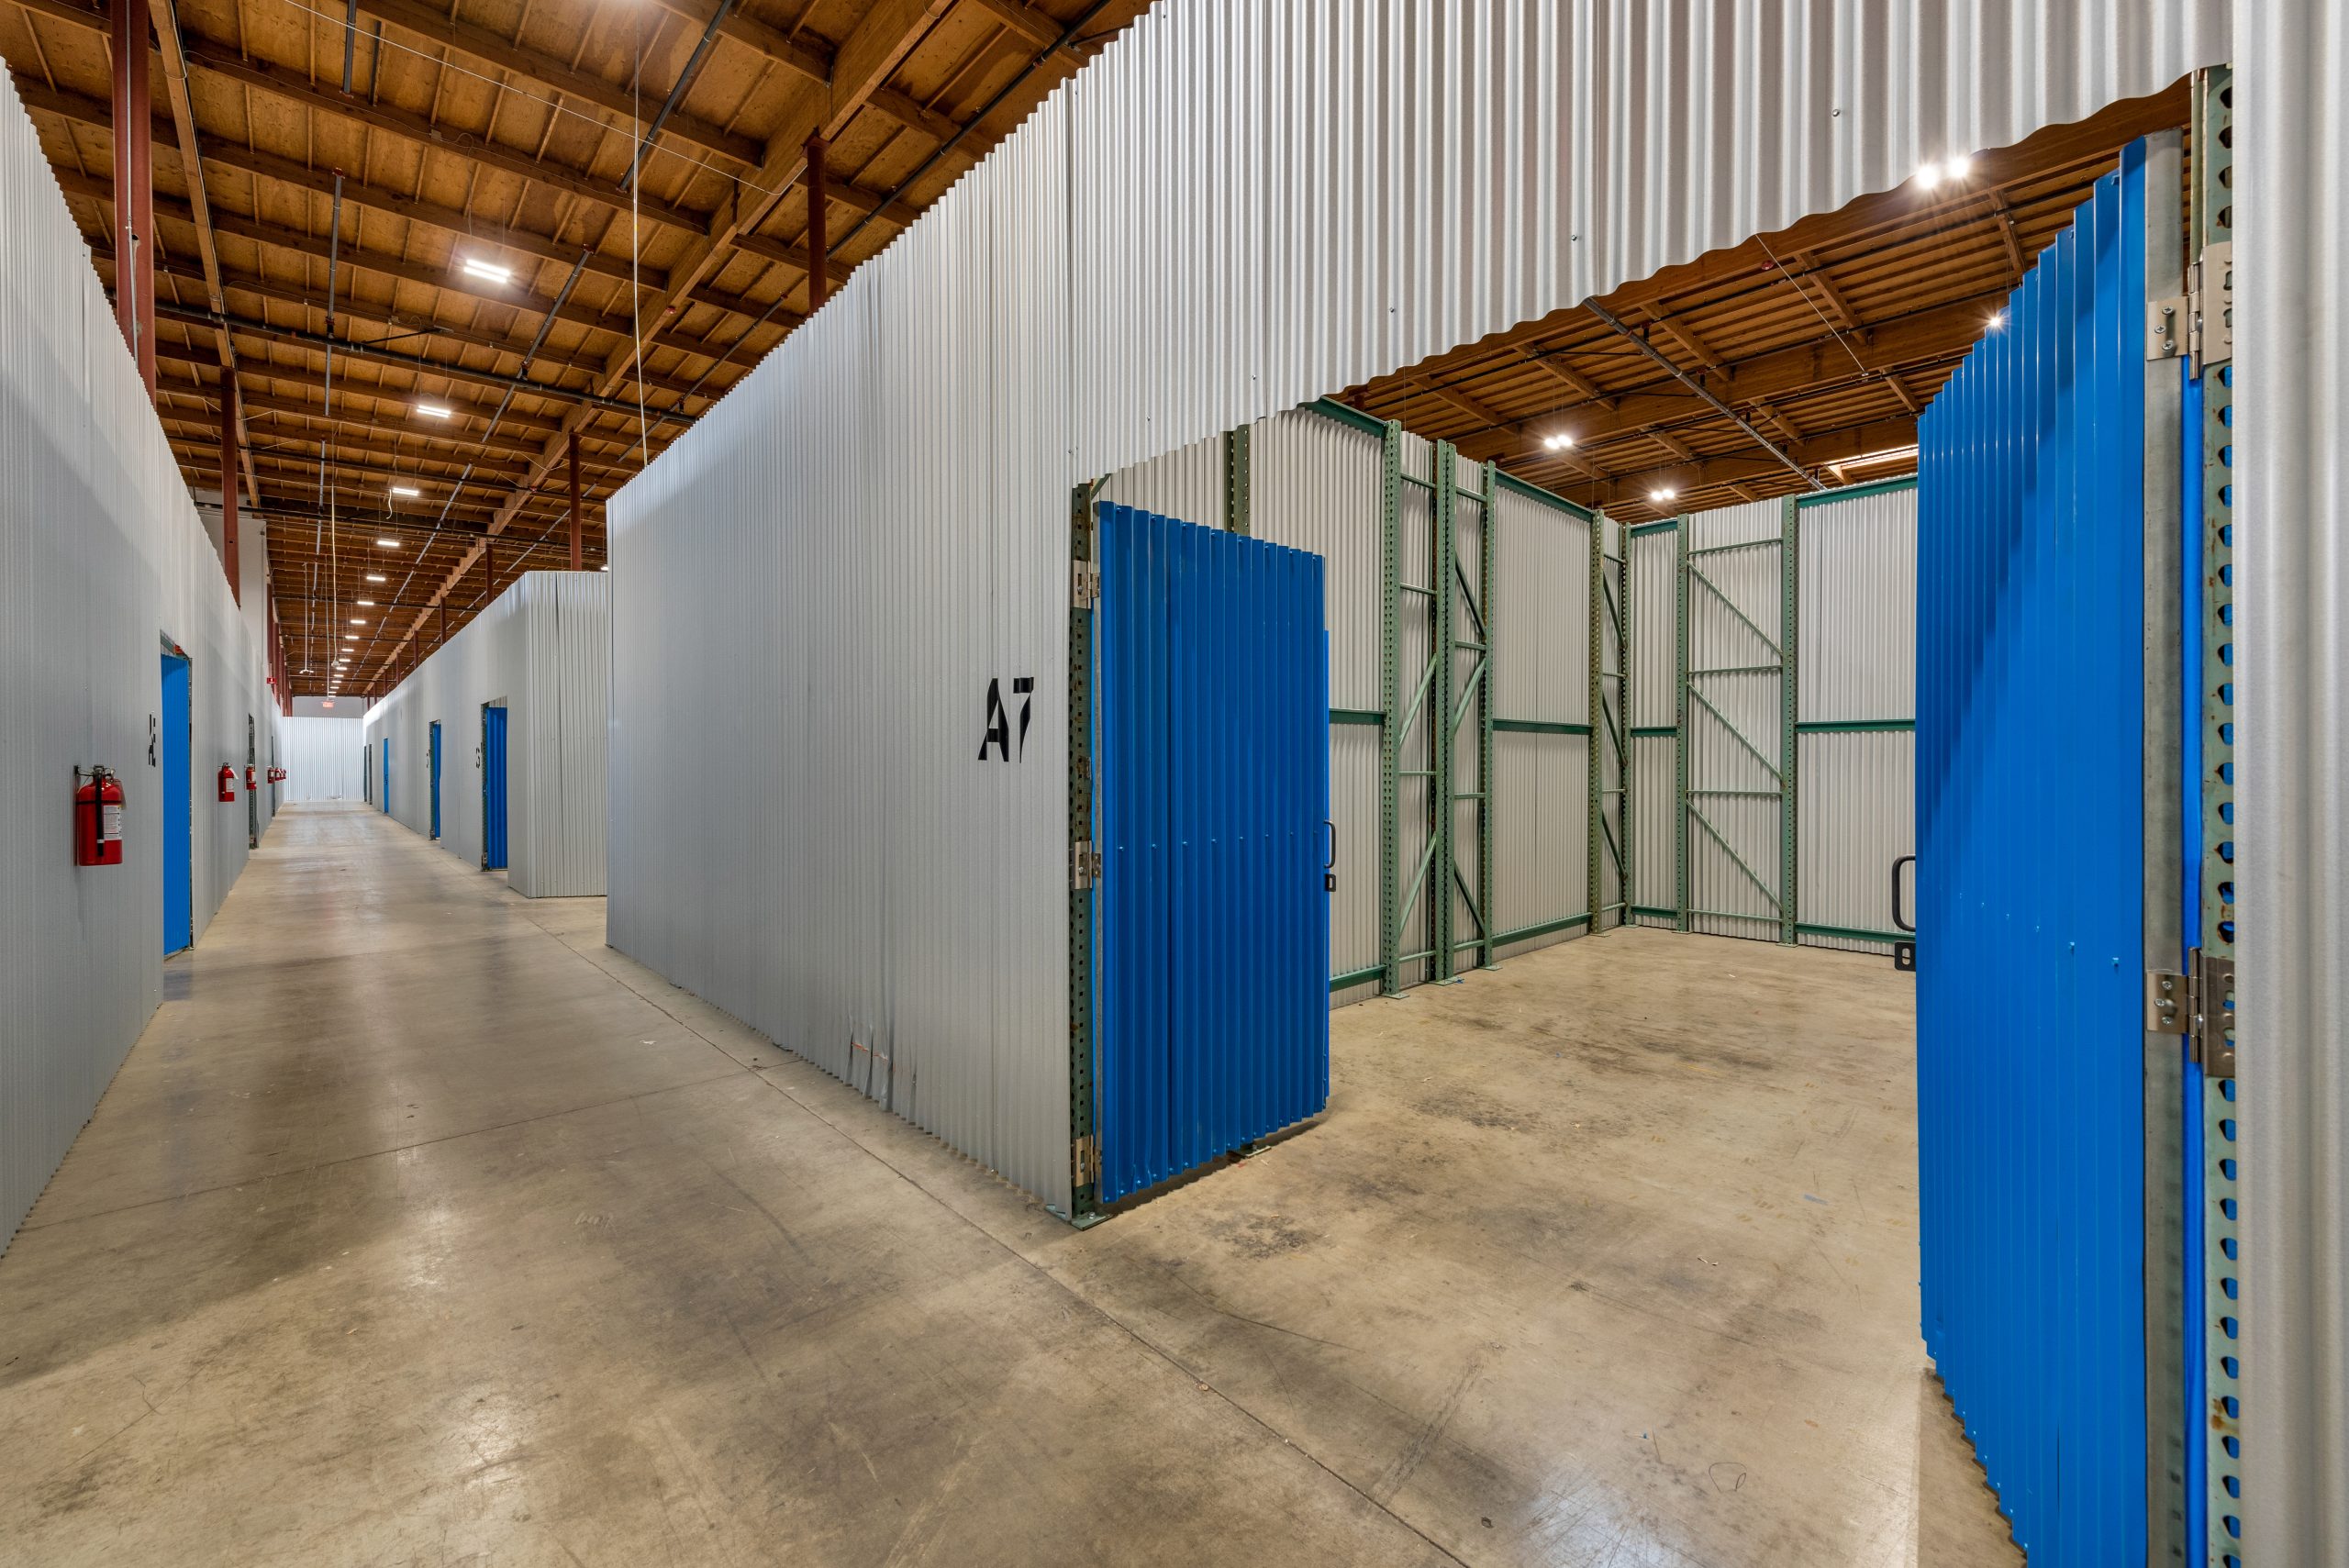
Orange County’s high rents and limited small-bay inventory make it a natural fit for co-warehousing, the shared-warehouse model that offers flexible terms and smaller units than a traditional industrial lease. Operators typically offer units from a few hundred square feet to several thousand, with month-to-month or short-term options that let businesses scale without committing to a multi-year NNN lease.
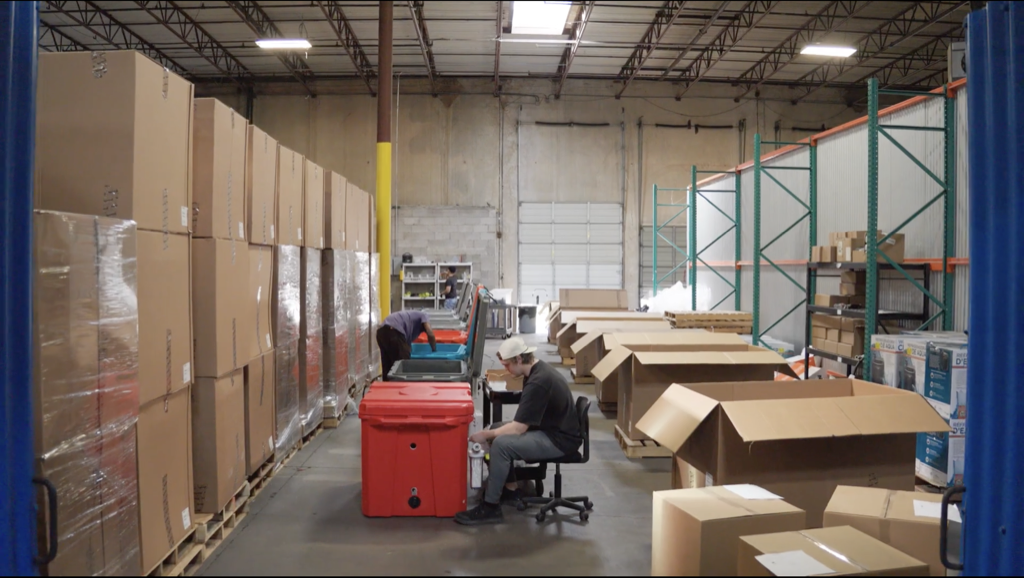
For businesses that need under 5,000 SF, co-warehousing is worth comparing against traditional space. The monthly cost per square foot can be higher than a long-term lease. But with no long-term commitment, shared amenities (loading docks, forklifts, WiFi) and no upfront tenant improvement costs, the total cost of occupancy often works out more favorably for growing businesses. WareCRE lists co-warehousing and flexible industrial space across Orange County, including Santa Ana.
Browse co-warehousing and small-bay listings in Orange County
Key Trends to Watch
1. Leasing Is Up, but Occupancy Is Still Falling
First-half leasing reached 4.8 million SF, up 5.8% year over year, yet net absorption was negative 1.3 million SF. C&W attributes the vacancy increase mainly to tenant relocations and speculative deliveries entering the market without pre-leasing. Q2 leasing of about 2.0 million SF was down 27.7% from Q1 and 10.6% from a year earlier. Read more: Small-Bay vs. Big-Box: What the Vacancy Gap Means in 2026.
2. Warehouse Vacancy Is More Than Three Times Manufacturing Vacancy
Warehouse/distribution vacancy is 7.5%, compared with 2.2% for manufacturing, 3.4% for flex and 4.9% for R&D. Yet warehouse rents rose in Q2 while manufacturing rents fell. Occupiers with warehouse requirements have the most options; those needing manufacturing space face a much tighter market.
3. Defense Tech Is Expanding in the Greater Airport Area
Anduril leased 177,766 SF in Tustin in Q2 after C&W’s Q1 report listed its 313,214 SF South Coast Technology Center in Santa Ana under construction. C&W expects occupiers to stay disciplined on space requirements and location, and cites trade-policy uncertainty and normalizing port volumes as factors in a selective leasing market. See How Tariffs Are Reshaping Warehouse Demand in 2026.
Outlook: What to Watch in Q4 2026
C&W’s Q3 2026 MarketBeats are due in mid-October, with the year-end release to follow. C&W’s Q2 outlook expects industrial demand to “remain uneven” and leasing momentum to “remain measured.”
Watch whether absorption turns positive. After negative 955,752 SF in Q1 and negative 362,429 SF in Q2, a positive quarter would be the first sign that vacancy is peaking near 5.2%.
Watch whether the warehouse rent gain holds. Warehouse/distribution rents rose 3.3% in Q2 despite 7.5% vacancy. A second quarter of gains would suggest landlords are holding rate on well-located space.
Watch how fast North County’s speculative space leases. North County holds more than half of the county’s pipeline, and the pace of lease-up will set the direction of vacancy in the county’s largest submarket.
Search Orange County Warehouse Space
Compare co-warehousing and small-bay listings across Orange County.
Data sources: Cushman & Wakefield Orange County Industrial MarketBeat Q2 2026 (headline, submarket, product-type, leasing, construction and sales figures; rents NNN, $/SF/mo; sales data from RCA); Cushman & Wakefield Orange County Industrial MarketBeat Q1 2026 (Santa Ana and Anaheim transactions and projects); Cushman & Wakefield U.S. Industrial MarketBeat Q2 2026 (restated Q1 2026 and Q2 2025 figures, annual rent and U.S. averages); Matthews Orange County Industrial Market Report Q2 2026, citing CoStar data (cap rate only). Each report reflects the most recent vacancy, rental, and construction data available at the time of publication. We refresh our reports as new market data is released, and we’re continually expanding coverage to additional metros.
Related Resources
Frequently Asked Questions
What is the current industrial vacancy rate in Orange County?
Orange County industrial vacancy was 5.2% in Q2 2026, according to Cushman & Wakefield, up 20 basis points from Q1 and 100 basis points year over year. The U.S. average in the same release was 6.9%. By submarket, vacancy ranges from 4.3% in the Greater Airport Area to 7.4% in South County.
How much does warehouse space cost in Orange County?
The average industrial asking rent in Orange County was $1.52/SF/mo NNN in Q2 2026, up 3.0% from Q1 and flat year over year. Warehouse/distribution space also averaged $1.52 and manufacturing $1.37. By submarket, averages run from $1.39 in North County to $1.83 in South County.
What are industrial market conditions in Santa Ana and Anaheim?
Cushman & Wakefield reports at the submarket level. Santa Ana sits in the Greater Airport Area, the county’s tightest submarket at 4.3% vacancy with an average asking rent of $1.46/SF/mo NNN. Anaheim sits in North County, at 5.1% vacancy and $1.39/SF/mo NNN. Two speculative projects totaling about 261,000 SF are under construction in Anaheim.
How much industrial space is under construction in Orange County?
972,936 SF across nine buildings was under construction at the end of Q2 2026, 586,614 SF of it speculative and 386,322 SF build-to-suit. North County holds 498,450 SF and the Greater Airport Area 386,322 SF.
What are industrial cap rates and sale prices in Orange County?
Matthews, citing CoStar data, reported an average industrial cap rate of 5.4% in Orange County in Q2 2026. Cushman & Wakefield, using RCA data, reported $428M of industrial sales in Q2 at an average price of about $280/SF, down 11.3% year over year.