San Diego Industrial Vacancy Hits 7.2% — But South County Tells a Different Story | 2026 Warehouse Market Report
2026 Analysis: Positive Absorption, Declining Vacancy
Key Takeaways
- Market Stabilization: Vacancy declined 30 basis points QOQ to 7.2%, indicating sustained demand and supply balance improvement.
- Positive Momentum: Second consecutive quarter of positive net absorption (456K SF YTD) signals healthy tenant demand across product types.
- Rent Correction: Average asking rents down 6.5% YOY to $1.47 PSF/month NNN, reflecting competitive market dynamics and ample supply.
- Strong Leasing Activity: Full-year leasing volume reached 5.6 MSF, up 17.7% YOY, driven by transportation, manufacturing, and wholesale sectors.
- Pipeline Concerns: 6.7 MSF proposed (60% concentrated in Otay Mesa) may pressure rents unless absorption continues to track with deliveries.
San Diego Industrial Market Overview
San Diego’s industrial market has entered a recovery phase following a challenging 2024. The fourth quarter of 2025 marked a turning point with measurable improvements in core metrics: vacancy declining, absorption rebounding to positive territory, and leasing activity accelerating compared to the prior year. Anchored by continued foreign trade growth through the Port of San Diego and robust manufacturing demand, the region’s 1.6-million-person workforce supports sustained logistics and distribution needs.
The region’s unemployment rate stands at 4.7%, supporting steady tenant demand. Distribution, transportation, and warehousing tenants comprise 24% of leasing volume, while manufacturing represents 20% and wholesale/defense accounts for 10% each. This diversification reduces dependence on any single sector and provides a resilient foundation for long-term market health.
Economic headwinds including higher interest rates and operational costs have moderated asking rents across all product types, creating entry opportunities for new and relocating tenants. Investment sales activity recovered in Q4 2025 with $372 million in transaction volume, up 37% QOQ and averaging $284 PSF—up 24% YOY—signaling renewed institutional capital interest.
Supply & Demand Fundamentals
Vacancy Trends
The overall direct vacancy rate in Q4 2025 sits at 7.2%, representing a 30-basis-point improvement from the 7.5% recorded in Q3 2025. This marks meaningful progress toward pre-pandemic equilibrium levels. However, year-over-year comparison reveals a 70-basis-point increase from Q4 2024’s 6.5%, underscoring the market’s modest oversupply relative to long-term averages.
Direct vacancy specifically—which excludes shadow space and owner-occupied properties—stands at 6.7%, up 90 basis points YOY. This divergence between overall and direct vacancy suggests that owner-occupied and non-traditional spaces represent approximately 0.5% of the total market. Most critically, Q1 2025 peaked at 8.3% vacancy, meaning the market has recovered 110 basis points in just three quarters—a strong indication of healthy demand absorption.
Absorption Dynamics
Year-to-date net absorption totals 456,000 square feet, marking the second consecutive quarter of positive absorption. This reversal is significant: Q1 2025 recorded negative absorption of 703,000 square feet, indicating a total swing of over 1.1 million SF into positive territory within a single year. This trajectory suggests structural market healing rather than temporary cyclical recovery.
Tenant demand remains strongest in the 20,000 to 50,000 SF range, which comprises 26% of expiring leases. Space under 20,000 SF accounts for 31% of expiring tenancies, indicating strong demand across the mid-market spectrum. Industry experts anticipate 4.2 million SF of demand over the next two years, providing substantial runway for new deliveries and lease-up of existing vacant space.
Leasing Activity
Full-year 2025 leasing volume reached 5.6 million square feet, up 17.7% compared to 4.8 million SF in 2024. Q4 2025 alone recorded 1.2 million SF of leasing activity. Notable move-ins during Q4 included Enterprise Rent-A-Car (128,000 SF), Krieger Worldwide (67,000 SF), and Zonson USA (63,000 SF), representing high-quality, credit-strong tenants that typically maintain longer lease terms. Amazon’s Otay Mesa 1.1-million-SF build-to-suit delivered in Q3 2025, positioning the region for continued logistics sector dominance.
Pricing Trends & Rent Analysis
Average asking rents across all San Diego industrial product types declined to $1.47 per square foot per month on a triple-net (NNN) basis in Q4 2025, down 0.7% quarter-over-quarter and 6.5% year-over-year. This moderation reflects a competitive leasing environment where landlords are adjusting pricing to attract and retain quality tenants.
Product-type-specific declines reveal manufacturing as the most affected segment, with rents declining 9.1% YOY. Standard warehouse space experienced a 5.9% YOY rent decline, while specialized products showed relative stability. These declines, though notable, remain within historical norms for market-correction cycles and do not indicate distress pricing.
Submarket Rent Performance
Geographic rent variation across San Diego’s three primary subregions illustrates divergent market dynamics:
- Central County: Most resilient pricing, with rents declining only 2.3% YOY. Premium locations like UTC ($3.20 PSF) and Sorrento Mesa ($3.17 PSF) command significant premiums and serve as anchors for the submarket’s stability.
- North County: Experienced a 6.2% YOY rent decline. Carlsbad and Vista captured 12% each of total leasing volume, indicating continued operator interest despite pricing pressure. Most affordable options: Vista ($1.36 PSF), Oceanside ($1.27 PSF).
- South County: Rents remain flat YOY at $1.47 PSF average, but vacancy declined meaningfully from 13.1% in Q2 2025 to 11.6% in Q4—the most improved submarket. San Ysidro represents the region’s value anchor at $1.23 PSF, serving smaller operators and e-commerce fulfillment.
Submarket Comparison
| Submarket | Q4 Vacancy | Avg Rent (PSF/mo) | YOY Rent Change | 2025 Leasing Volume |
|---|---|---|---|---|
| Central County | 5.1% | $2.68 | -2.3% | Premium logistics |
| North County | 6.6% | $1.45 | -6.2% | Carlsbad, Vista active |
| South County | 11.6% | $1.18 | 0.0% | Value seekers, SMB |
Data source: Cushman & Wakefield Q4 2025 MarketBeat
Construction Pipeline & Future Supply
San Diego’s industrial construction pipeline presents a mixed outlook. Currently, 854,000 square feet remains under active construction: 744,000 SF in Otay Mesa and 110,000 SF in Escondido. These projects represent primarily build-to-suit opportunities and planned spec developments aimed at the logistics and e-commerce sectors.
The proposed pipeline, however, stands at a substantial 6.7 million square feet. Notably, Otay Mesa accounts for 60% of this proposed supply (4.0 million SF), reflecting strategic positioning for international trade and border-adjacent logistics. This concentration poses a risk: if deliveries outpace absorption, South County vacancy could deteriorate significantly despite current positive momentum.
Given the anticipated 4.2 million SF of demand over the next two years, the market should comfortably absorb the planned construction pipeline provided leasing momentum maintains current trajectory. However, market participants should monitor quarterly absorption rates closely; a slowdown below 200K SF per quarter could signal timing concerns for speculative developments.
Pro Tip
Timing is favorable for tenant negotiations. With average rents down 6.5% YOY and competitive landlord positioning, tenants renewing leases or seeking new space should expect meaningful rent concessions, TI packages, and favorable lease terms. For operators in the 20K–50K SF range, this represents an optimal window to lock in below-market pricing before potential market tightening.
Ready to explore available industrial space in San Diego?
Browse San Diego Industrial PropertiesFeatured WareCRE Listing
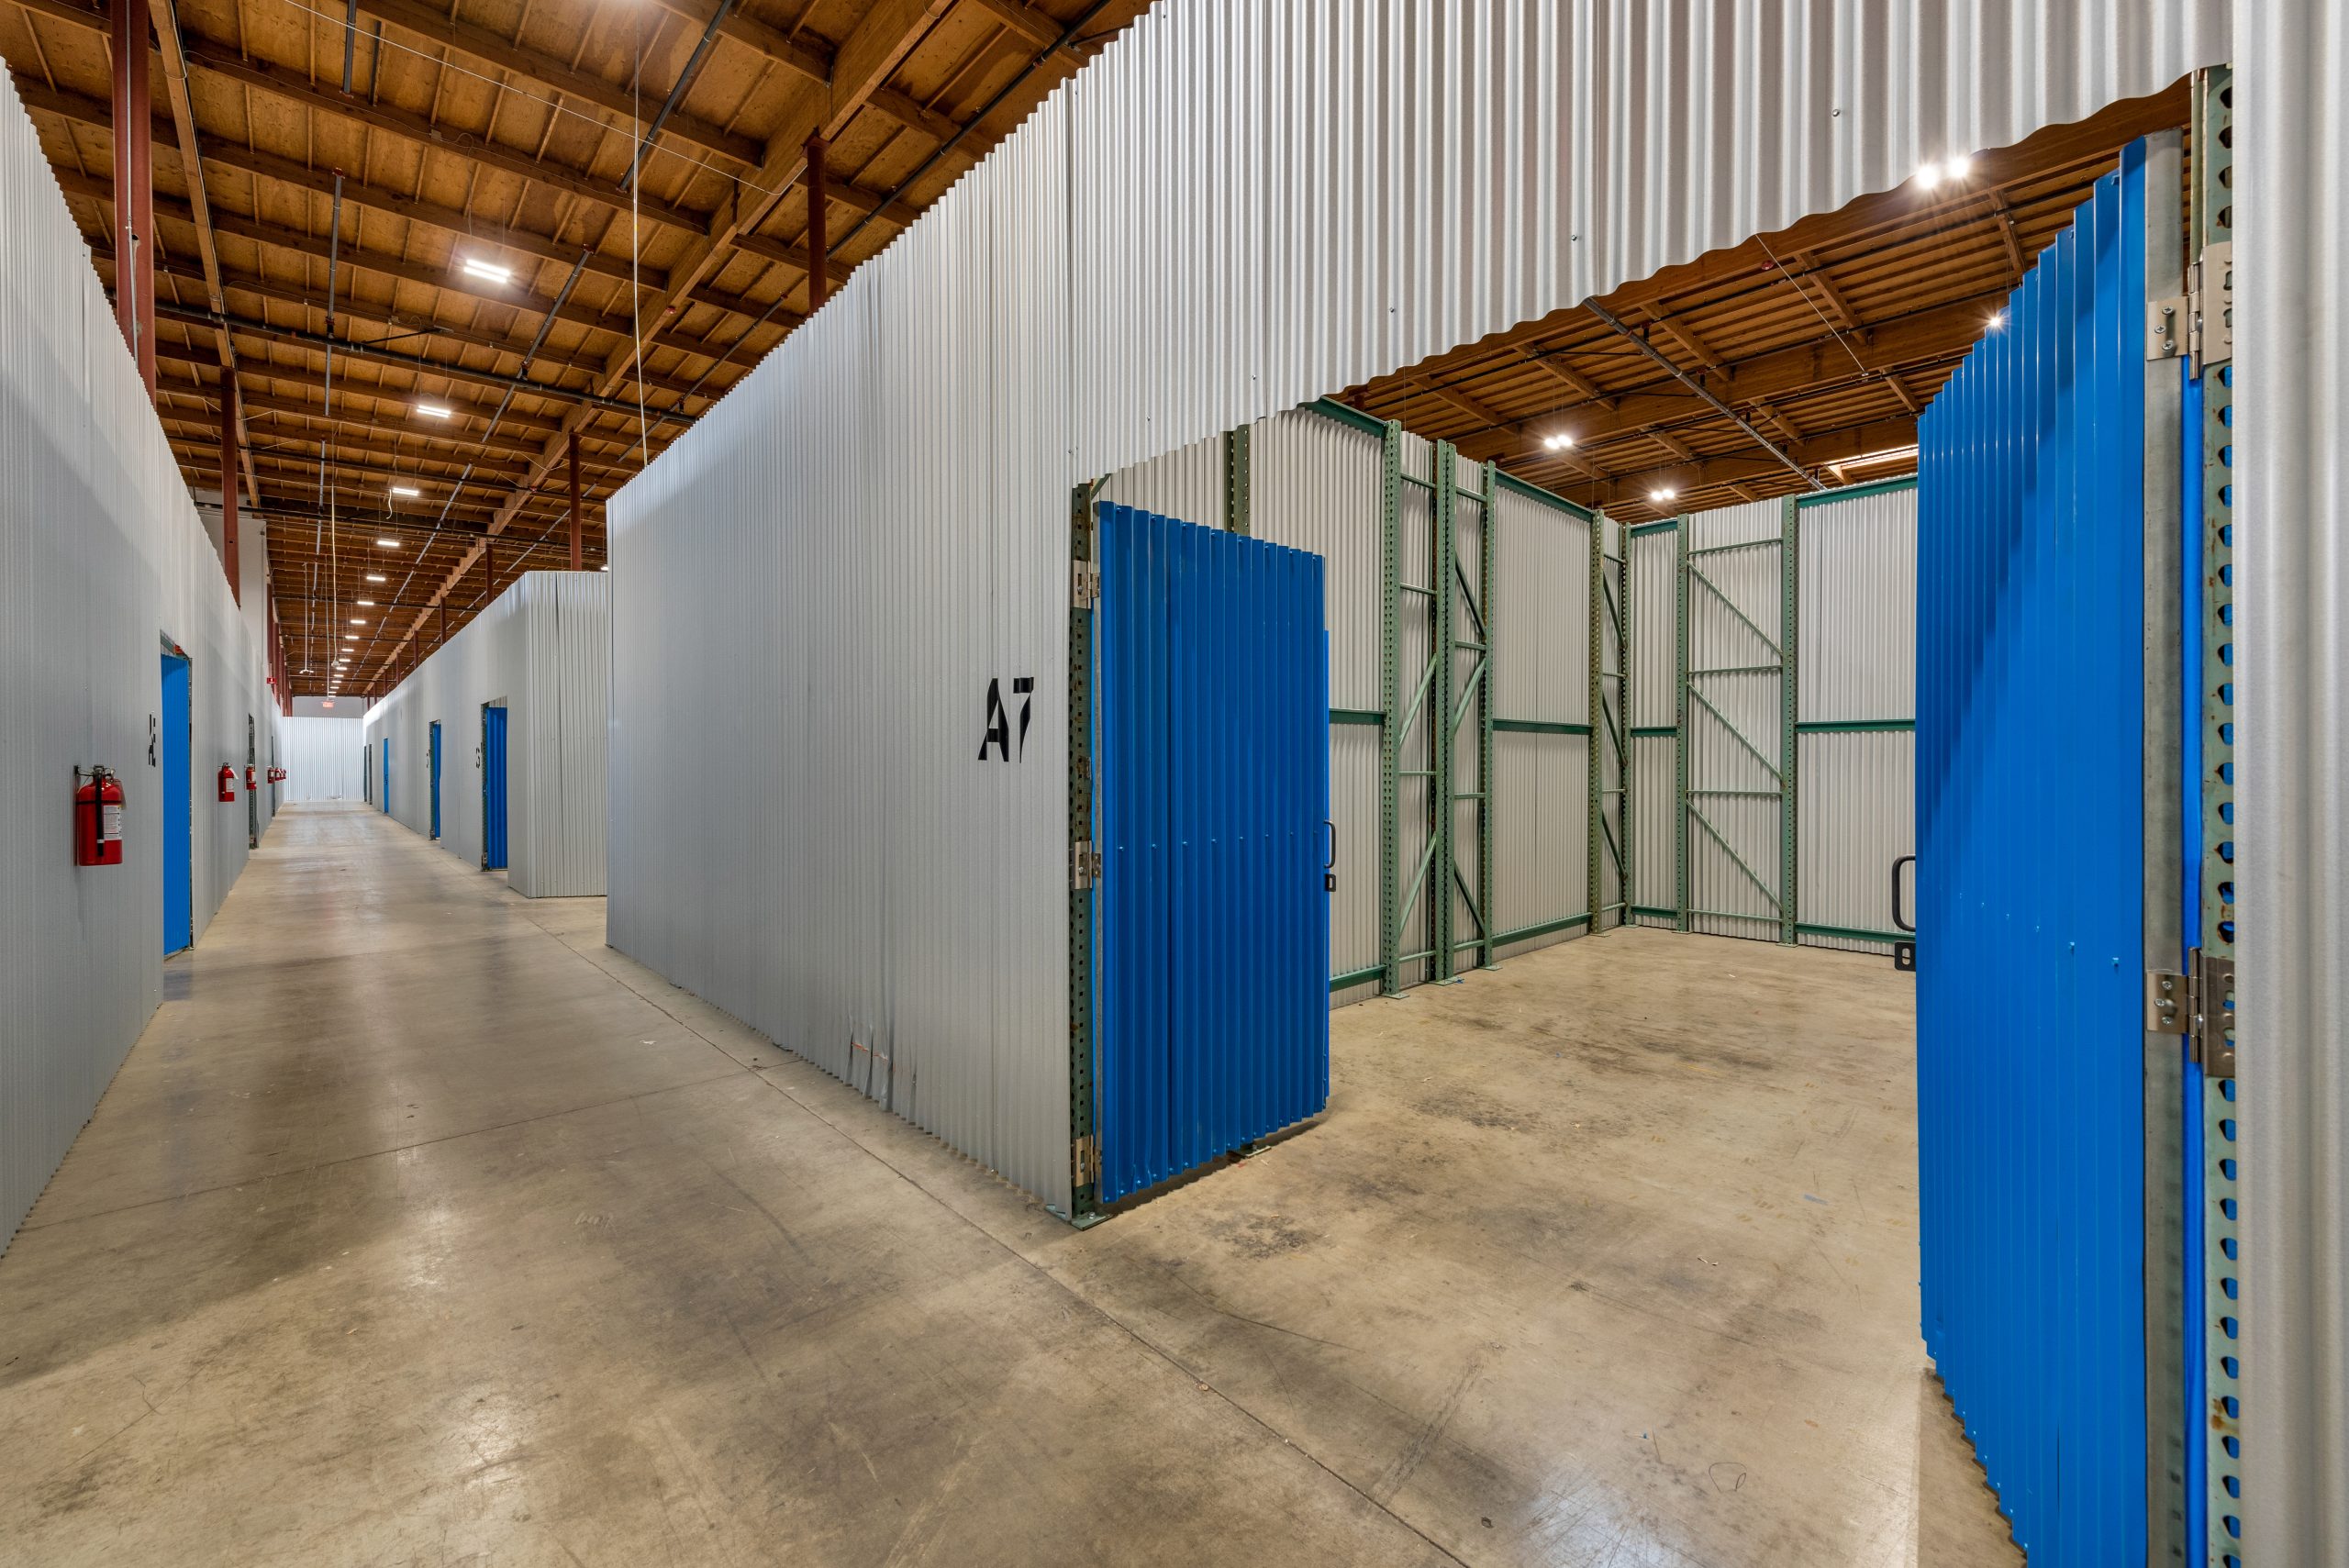
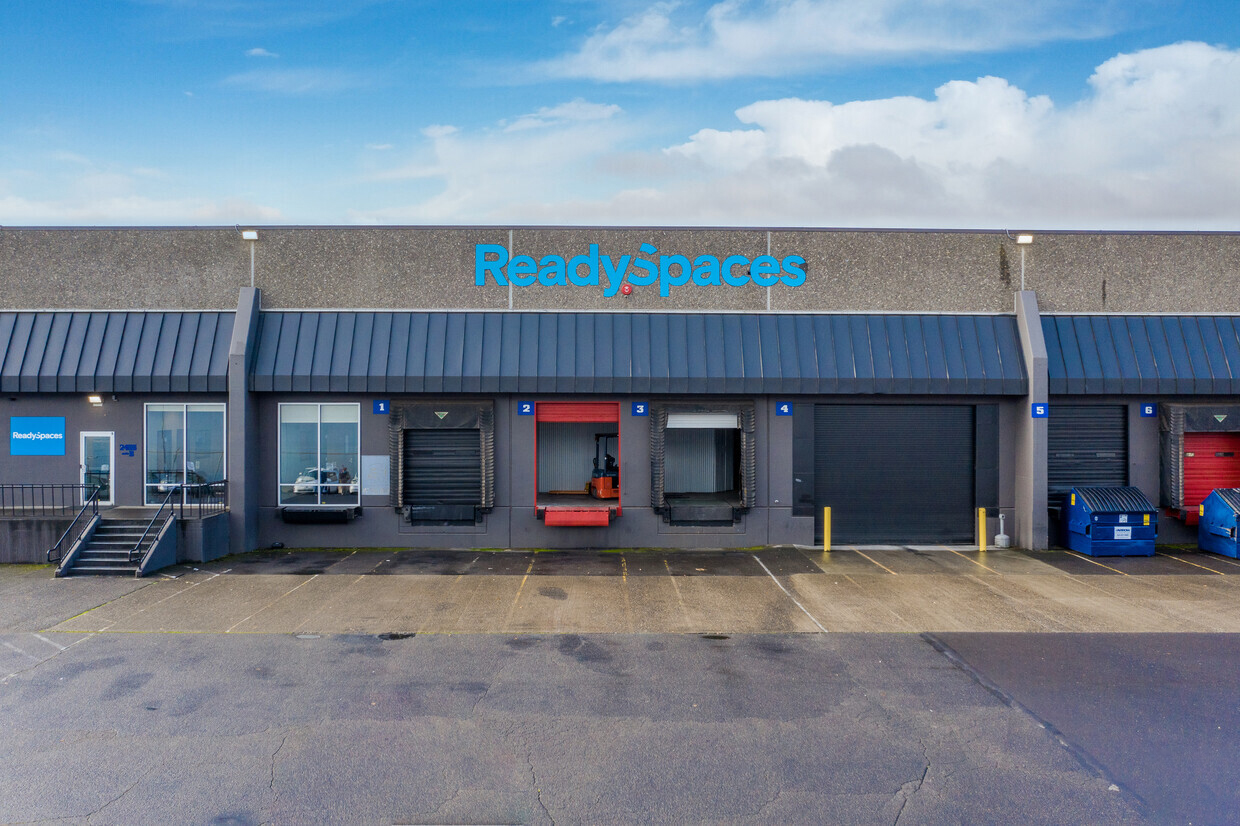
ReadySpaces Chula Vista — 505 Main Street
79,602 SF of modern warehouse space in South County’s most affordable market. 20′ clear height, 12 loading docks, and flexible lease terms. Positioned for value-conscious operators and growing SMB distributors.
View Property Details →Frequently Asked Questions
What is the warehouse vacancy rate in San Diego?
As of Q4 2025, San Diego’s overall industrial vacancy rate stands at 7.2%, down 30 basis points from Q3 2025. Direct vacancy is 6.7%. While this represents a 70-basis-point increase year-over-year, the market has recovered 110 basis points from Q1 2025’s peak of 8.3%, signaling positive momentum. Vacancy varies by submarket: Central County (5.1%), North County (6.6%), and South County (11.6%).
How much does warehouse space cost in San Diego?
Average asking rents in Q4 2025 are $1.47 per square foot per month on a triple-net (NNN) basis, down 6.5% year-over-year. Pricing varies significantly by location: premium Central County submarkets (UTC, Sorrento Mesa) command $3.00+ PSF; North County averages $1.45 PSF; South County offers the most affordable options at $1.18 PSF average, with San Ysidro as low as $1.23 PSF.
What are the best industrial submarkets in San Diego?
Central County dominates for premium logistics and e-commerce with lowest vacancy (5.1%) and highest rents; ideal for enterprise tenants. North County (Carlsbad, Vista, Oceanside) offers balanced accessibility and competitive pricing for mid-market operators. South County (Otay Mesa, San Ysidro, Chula Vista) provides exceptional value and proximity to the Mexican border for cross-border trade; currently experiencing the strongest vacancy improvement (from 13.1% to 11.6% in two quarters).
Is San Diego’s industrial market recovering?
Yes. San Diego’s industrial market is in sustained recovery: Q4 2025 marked the second consecutive quarter of positive net absorption (456K SF YTD), full-year leasing volume increased 17.7% YOY to 5.6 MSF, and vacancy declined 30 basis points QOQ. Investment sales activity rebounded with $372 million in Q4 transactions (up 37% QOQ). However, a substantial 6.7 MSF proposed pipeline—concentrated 60% in Otay Mesa—requires monitoring to ensure sustained absorption supports new deliveries.
Where is most new warehouse construction happening in San Diego?
Currently, 854,000 SF is under construction: 744,000 SF in Otay Mesa and 110,000 SF in Escondido. The proposed pipeline concentrates 60% (4.0 million SF) in Otay Mesa, driven by strategic positioning for international trade, border adjacency, and e-commerce logistics. Key recent deliveries include Amazon’s 1.1 million SF build-to-suit in Otay Mesa (Q3 2025). North County (Carlsbad, Vista) and Central County also see active development tied to specific tenant demand.
Find Your Ideal Industrial Space in San Diego
WareCRE connects tenants and investors with premium warehouse, manufacturing, and logistics properties across Southern California. With real-time market insights and personalized expertise, we help you navigate San Diego’s dynamic industrial landscape.
View Available PropertiesContact our San Diego industrial specialists for site tours, lease negotiation, and investment opportunities.