Washington DC (DMV) Industrial & Warehouse Market Report | Q2 2026
Key Takeaways
- Cushman & Wakefield reports the DMV as two industrial markets. In Q2 2026, Northern Virginia vacancy rose 20 basis points to 5.0%, flat year over year. Suburban Maryland eased 20 basis points to 11.0%, still up 150 basis points on the year.
- Northern Virginia posted −46,400 SF of net absorption as Belfort Furniture, INOVA and the State Department vacated space, taking the year to date to −65,700 SF. Suburban Maryland absorbed +148,500 SF, led by warehouse move-ins in Bowie.
- Rents moved in opposite directions. Northern Virginia’s average asking rent rose $0.21 to $17.44/SF/yr net; Suburban Maryland’s fell $0.85 year over year to $15.16/SF/yr net.
- 647,493 SF is under construction in Northern Virginia and 538,818 SF in Suburban Maryland. Frederick County accounted for 88% of Suburban Maryland’s new supply this year and sits at 27.1% vacancy.
Browse warehouse space for rent in Washington DC
5.0% / 11.0%
Vacancy (Q2 2026): N. Virginia / Suburban MD
$17.44 / $15.16
Avg. Asking Rent ($/SF/yr net): NoVA / Sub. MD
−46K / +148K
SF Net Absorption (Q2 2026): NoVA / Sub. MD
647K / 539K
SF Under Construction: NoVA / Sub. MD
The DMV’s two industrial markets moved apart in Q2 2026. Northern Virginia gave back space and its vacancy edged up, although asking rents kept rising. Suburban Maryland added occupancy, but its vacancy is still in double digits after a wave of new supply in Frederick County, and its rents are lower than a year ago.
Figures are from Cushman & Wakefield’s Q2 2026 Northern Virginia and Suburban Maryland Industrial MarketBeats unless noted. C&W reports the two markets separately, so this report presents them side by side. Where we combine them, the math is shown and labelled as a WareCRE calculation. Prior-quarter comparisons use the figures as restated in the Q2 reports, and rents are weighted net asking rents in $/SF/yr.
Market Snapshot: Q2 2026
Northern Virginia
| Metric | Q2 2026 | Q1 2026 (restated) | YoY or note |
|---|---|---|---|
| Overall vacancy | 5.0% | 4.8% | +20 bps QoQ; flat YoY |
| Overall asking rent ($/SF/yr net) | $17.44 | $17.23 | +$0.21 QoQ |
| Warehouse/distribution vacancy and rent | 4.8%; $16.70 | n/a | 38.5M SF of warehouse/distribution space |
| Net absorption | −46,404 SF | −19,345 SF | −65,749 SF year to date; Q1 was first published at +4,526 SF |
| New leasing | 321,700 SF | n/a | Warehouse/distribution 243,000 SF (75%); 773,115 SF year to date |
| Deliveries | 128,640 SF year to date | n/a | All in Route 28 Corridor North |
| Under construction | 647,493 SF | n/a | 617,493 SF warehouse/distribution |
| Inventory | 61.1M SF | n/a | Warehouse/distribution and office service/flex |
Source: Cushman & Wakefield, Northern Virginia Industrial MarketBeat Q2 2026. Q1 vacancy and rent follow from the QoQ changes C&W states and match its Q1 report. Q1 absorption is year-to-date less Q2 (WareCRE calculation).
Suburban Maryland
| Metric | Q2 2026 | Q1 2026 (restated) | YoY or note |
|---|---|---|---|
| Overall vacancy | 11.0% | 11.2% | +150 bps YoY (9.5% in Q2 2025) |
| Overall asking rent ($/SF/yr net) | $15.16 | $15.68 | −$0.85 YoY (from $16.01) |
| Warehouse/distribution rent ($/SF/yr net) | $14.54 | n/a | Office service space $16.40 |
| Net absorption | +148,446 SF | −85,171 SF | +63,275 SF year to date; Q1 was first published at +61,601 SF |
| New leasing | 375,300 SF | 442,000 SF (as published) | n/a |
| Deliveries | 578,639 SF year to date | n/a | Frederick County 88% of new supply |
| Under construction | 538,818 SF | n/a | Another 1.7M SF proposed |
| Inventory | 54.0M SF | n/a | Montgomery, Prince George’s and Frederick counties |
Source: Cushman & Wakefield, Suburban Maryland Industrial MarketBeat Q2 2026. Q1 vacancy, rent and absorption as restated in C&W’s U.S. Industrial MarketBeat Q2 2026 metro tables; Q1 leasing marked “as published” is from the Q1 2026 report. Q1 absorption also equals year-to-date less Q2.
Combining the two reports gives a DMV vacancy rate of 7.8% (WareCRE calculation: 8,986,050 vacant SF out of 115,055,969 SF). That is above C&W’s U.S. average of 6.9%. Northern Virginia alone is below the national rate, and Suburban Maryland is above it.
Rent Trends: Northern Virginia Rises to $17.44/SF While Suburban Maryland Falls 5.3% on the Year
Northern Virginia’s average asking rent rose $0.21 in Q2 to $17.44/SF/yr net. Warehouse/distribution space averages $16.70/SF/yr and office service/flex space $18.61. Among warehouse submarkets, Route 28 Corridor North asks the most at $19.29/SF/yr and Manassas the least at $14.84.
Suburban Maryland moved the other way. Its average asking rent fell $0.85 from a year earlier to $15.16/SF/yr net, a 5.3% decline (WareCRE calculation). Warehouse/distribution space asks $14.54/SF/yr and office service space $16.40. Warehouse rents average $16.44 in Montgomery County and $13.94 in Prince George’s County.
For Tenants
Leverage depends on which side of the river you search. Frederick County sits at 27.1% vacancy and Bowie at 19.7%, so landlords there have space to fill. In Northern Virginia, Springfield/I-95 warehouse vacancy is 8.4% after the State Department left 57,200 SF. The tight spots are Route 28 Corridor South (1.3% warehouse vacancy), Manassas (2.2%) and Laurel (1.0%), where options are scarce. Search Washington DC warehouse listings on WareCRE.
Construction Pipeline: 1.19M SF Underway Across Both Markets
The two markets together have 1,186,311 SF under construction (WareCRE total of C&W’s two figures). In Northern Virginia, 647,493 SF is under way: 319,313 SF in Manassas, 224,640 SF in Route 28 Corridor North and 73,540 SF of warehouse space plus 30,000 SF of flex space in Route 28 Corridor South. Northern Virginia’s 128,640 SF of completions this year were all in Route 28 Corridor North.
Suburban Maryland has 538,818 SF under construction, led by 269,964 SF in Beltsville/College Park, 168,000 SF in Frederick County and 100,854 SF in North Bethesda/Rockville. It has delivered 578,639 SF this year, 88% of it in Frederick County, and C&W counts another 1.7 million SF of proposed buildings.
These C&W figures cover warehouse/distribution and flex buildings. CommercialSearch, which counts data centers as industrial space, reported in March 2026 that 13.2 million SF was under way across the region, up from 6.2 million SF a year earlier. Nearly half of it was data center space. The two measures are not comparable.
For Operators
C&W says that despite some recent givebacks, overall availability in Northern Virginia remains constrained, particularly in core logistics corridors. Manassas, at 2.2% warehouse vacancy with 319,313 SF under construction, is where new supply meets the tightest conditions. In Suburban Maryland, the priority is leasing up Frederick County’s new buildings, which have pushed its vacancy to 27.1%.
Submarket Breakdown
C&W tracks Northern Virginia in four submarkets, split by warehouse/distribution and office service/flex product, and Suburban Maryland by county. The four submarkets below carry most of the region’s warehouse activity this quarter.
Route 28 Corridor North (Northern Virginia)
The submarket has 12.6 million SF of warehouse/distribution space at 4.1% vacancy and the highest warehouse rent in Northern Virginia at $19.29/SF/yr net. Belfort Furniture vacated 83,300 SF and INOVA 30,200 SF here in Q2, leaving warehouse absorption at −46,874 SF year to date. 224,640 SF is under construction.
Springfield/I-95 (Northern Virginia)
Springfield/I-95 is the largest warehouse submarket at 13.2 million SF. Warehouse vacancy is 8.4%, the highest in Northern Virginia, after the State Department left 57,200 SF. Warehouse rent is $16.39/SF/yr net, and year-to-date warehouse absorption is −53,688 SF. The submarket’s flex space runs 10.1% vacancy. Nothing is under construction.
Manassas (Northern Virginia)
Manassas has 9.0 million SF of warehouse space at 2.2% vacancy and the lowest warehouse rent in Northern Virginia at $14.84/SF/yr net. It is the only Northern Virginia warehouse submarket with positive absorption this year (+28,064 SF) and holds the largest pipeline at 319,313 SF.
Prince George’s County (Suburban Maryland)
Prince George’s County has 35.0 million SF at 10.0% vacancy, with warehouse rent at $13.94/SF/yr net. The county absorbed +117,322 SF in Q2 and +223,047 SF year to date. Bowie, at 19.7% vacancy, absorbed 170,565 SF as JCM moved into 84,240 SF and Severn Group into 81,300 SF. Landover/Lanham runs 10.1% vacancy at $14.90/SF/yr for warehouse space, and Beltsville/College Park is at 6.4% with 269,964 SF under construction. C3M Power Systems signed a 141,246 SF new lease in Oxon Hill/Suitland.
| Northern Virginia submarket (warehouse/distribution) | Inventory | Vacancy | Rent ($/SF/yr net) | YTD Net Absorption | Under Construction |
|---|---|---|---|---|---|
| Springfield/I-95 | 13.2M SF | 8.4% | $16.39 | −53,688 SF | 0 SF |
| Route 28 Corridor North | 12.6M SF | 4.1% | $19.29 | −46,874 SF | 224,640 SF |
| Manassas | 9.0M SF | 2.2% | $14.84 | +28,064 SF | 319,313 SF |
| Route 28 Corridor South | 3.6M SF | 1.3% | $16.97 | −3,635 SF | 73,540 SF |
| Northern Virginia warehouse total | 38.5M SF | 4.8% | $16.70 | −76,133 SF | 617,493 SF |
Source: Cushman & Wakefield, Northern Virginia Industrial MarketBeat Q2 2026, warehouse/distribution rows.
| Suburban Maryland county (all industrial) | Inventory | Vacancy | W/D Rent ($/SF/yr net) | YTD Net Absorption | Under Construction |
|---|---|---|---|---|---|
| Prince George’s County | 35.0M SF | 10.0% | $13.94 | +223,047 SF | 269,964 SF |
| Montgomery County | 13.9M SF | 7.4% | $16.44 | −179,746 SF | 100,854 SF |
| Frederick County | 5.1M SF | 27.1% | n/a ($19.86 office service) | +19,974 SF | 168,000 SF |
| Suburban Maryland total | 54.0M SF | 11.0% | $14.54 | +63,275 SF | 538,818 SF |
Source: Cushman & Wakefield, Suburban Maryland Industrial MarketBeat Q2 2026.
Co-Warehousing & Flexible Warehouse Space in DC
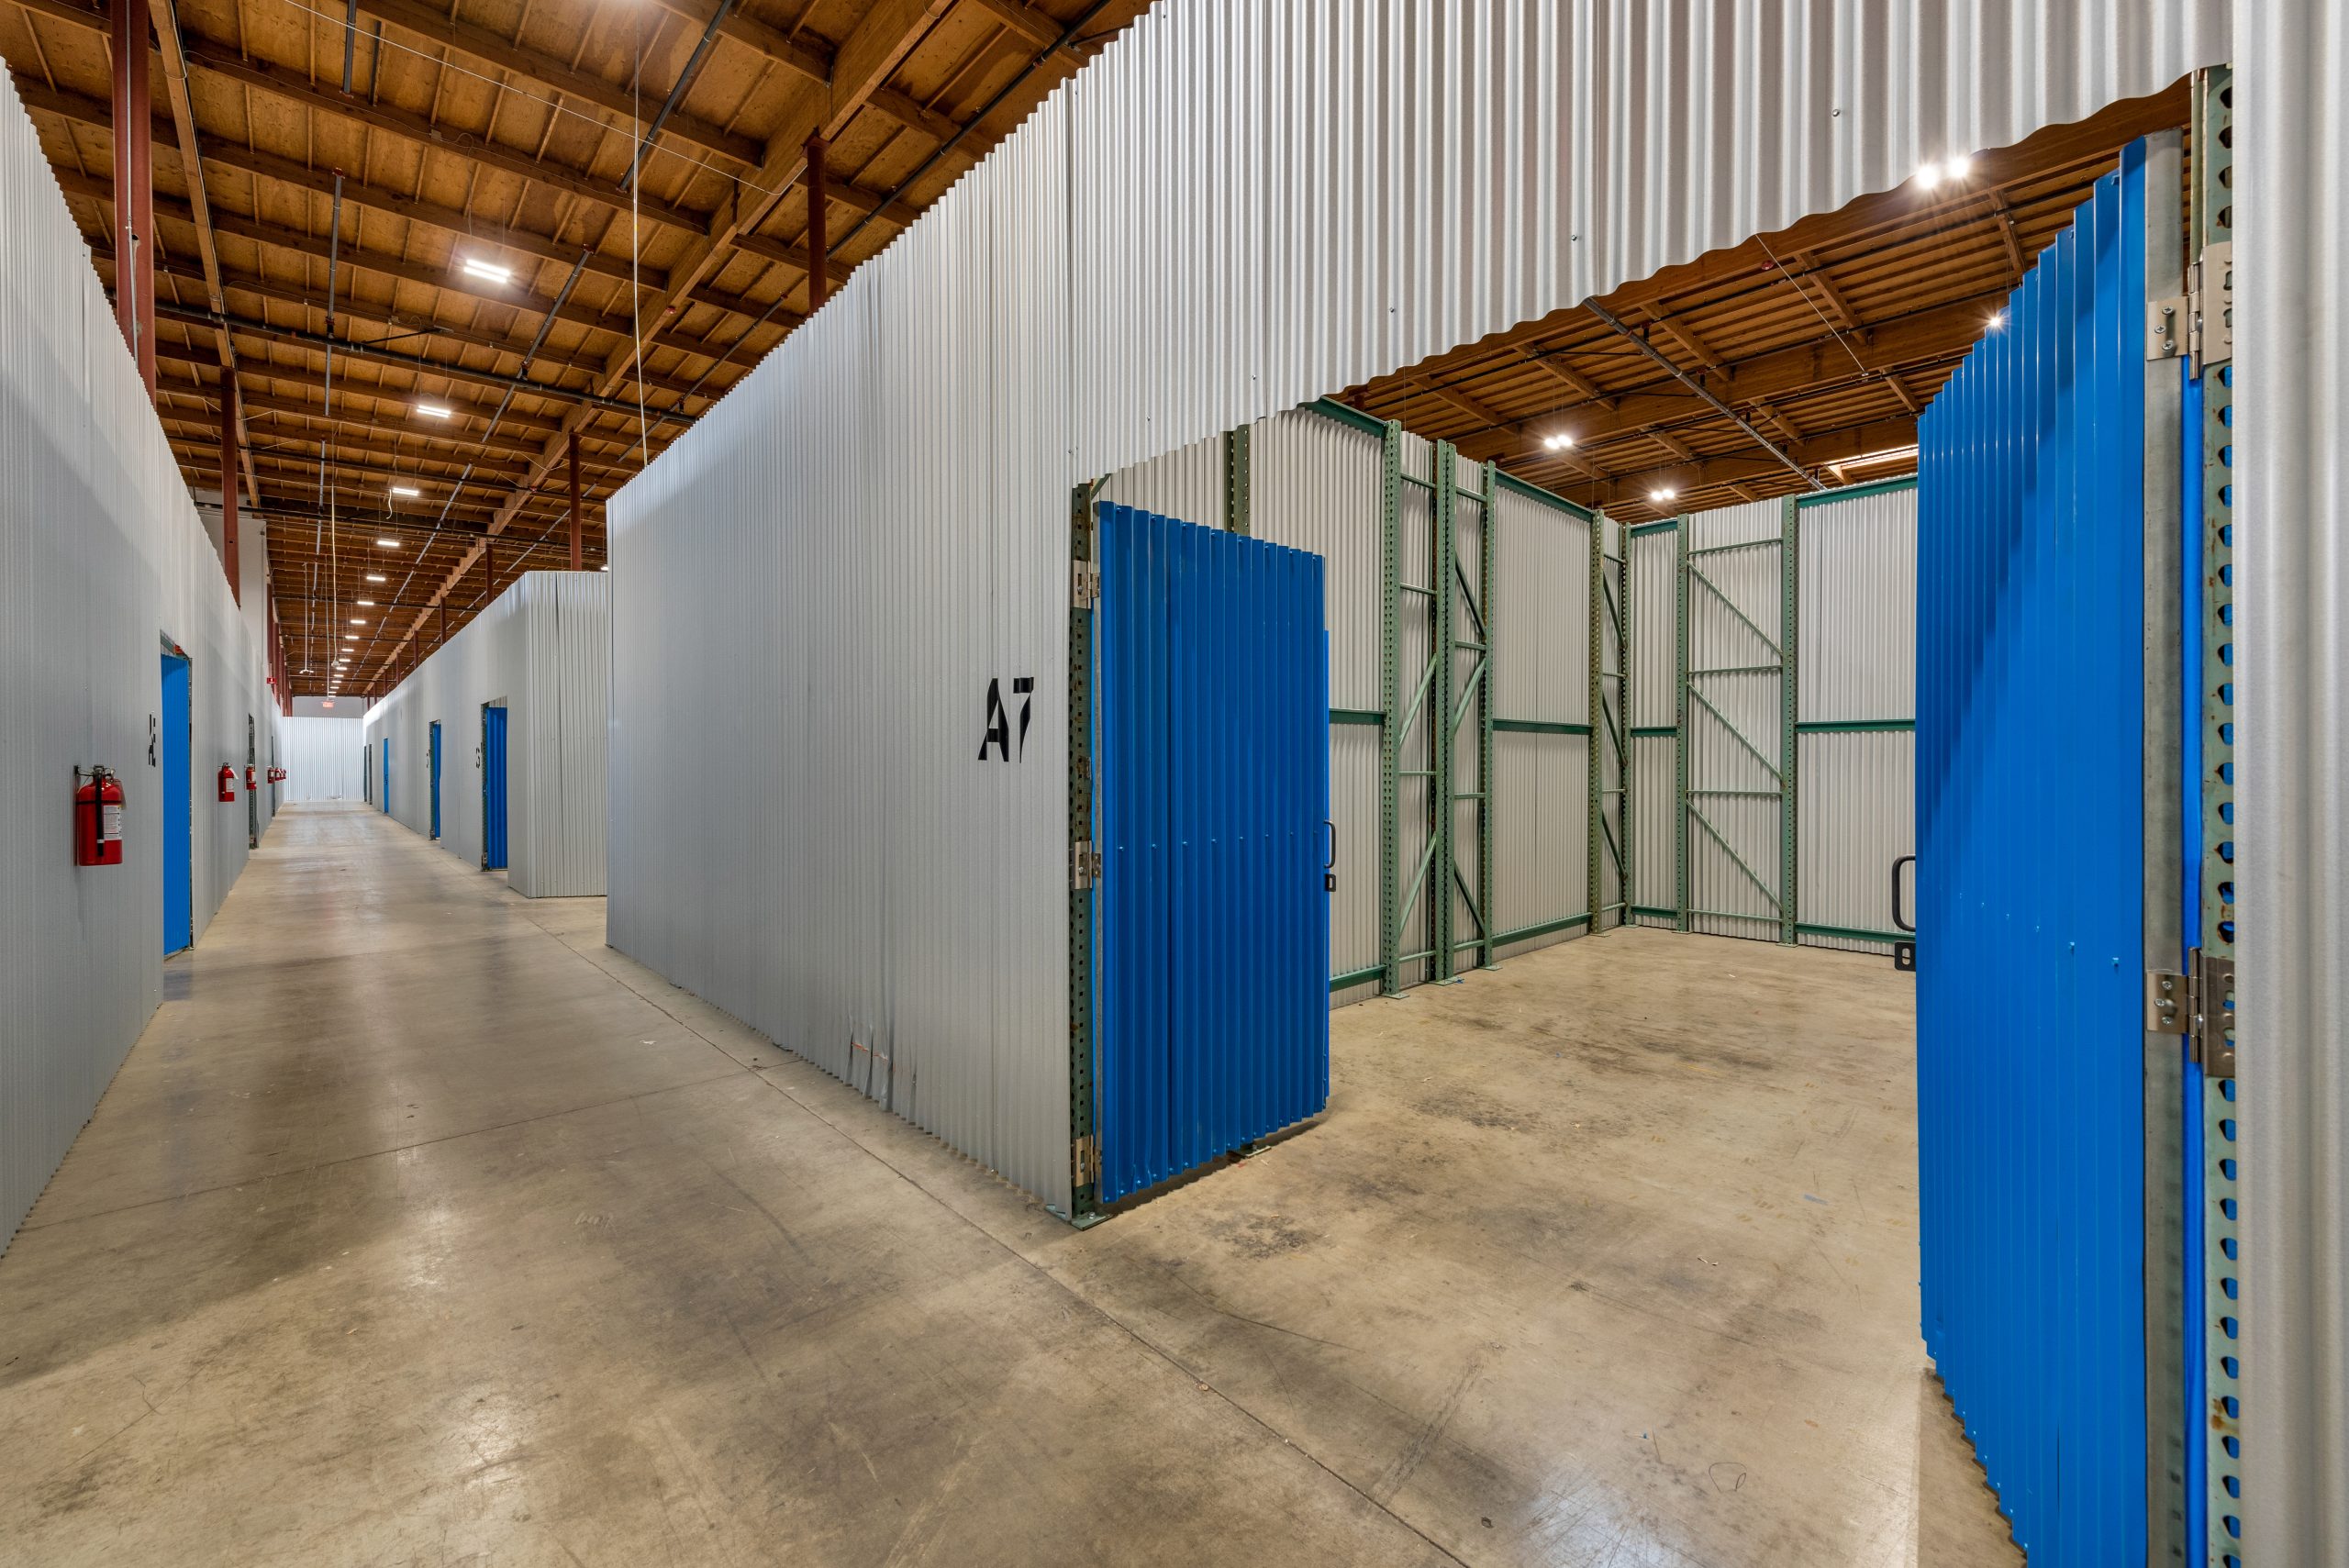
Small-bay users in the DMV compete for a limited pool of close-in space, which makes flexible and shared warehouse space a practical alternative to a long-term lease.
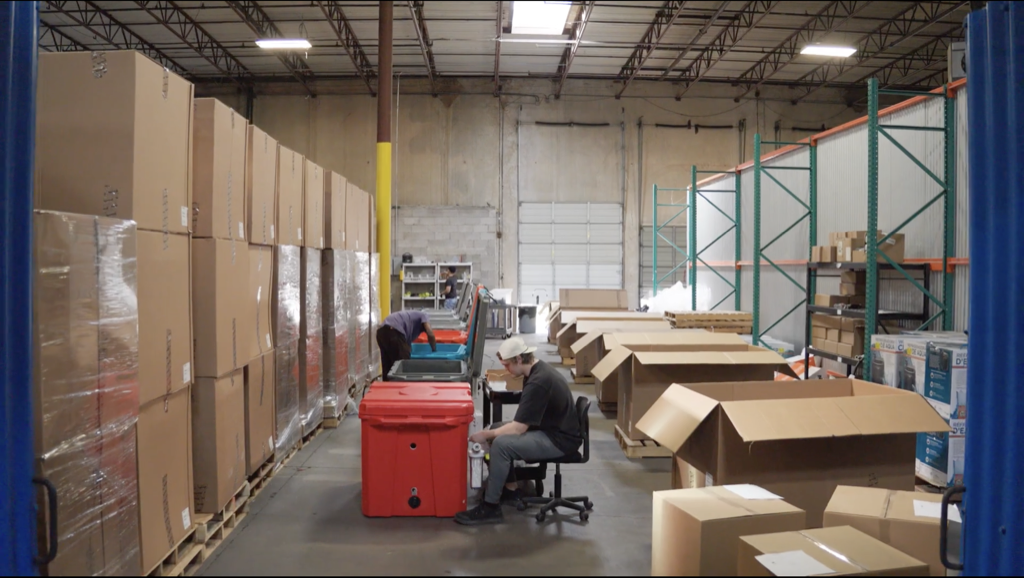
Government contractors are a core group of flexible-space users in DC, often needing secure staging and storage near federal facilities. E-commerce sellers, food and beverage distributors serving the region’s restaurants and caterers, construction and trades firms, and nonprofits storing event materials also lease it.
Browse available co-warehousing and small-bay warehouse listings on WareCRE’s Washington DC marketplace.
Looking for warehouse space in Washington DC?
Key Trends to Watch
1. Northern Virginia’s Absorption Streak Has Ended
C&W first reported Q1 2026 as Northern Virginia’s fifth consecutive quarter of positive absorption, at +4,526 SF. Its Q2 report puts year-to-date absorption at −65,749 SF, which implies Q1 was restated to −19,345 SF (WareCRE calculation). With −46,400 SF in Q2, C&W says the market reversed the positive momentum of prior periods.
2. Data Centers Compete for Land, but the PW Digital Gateway Rezoning Was Voided
Data center demand still sets land prices in parts of Northern Virginia. Amazon Data Services paid $700 million for about 188.5 acres in Bristow, in Prince William County, in a deal that closed November 5, 2025. A Prince William circuit court voided the PW Digital Gateway rezoning in August 2025, and the Virginia Court of Appeals upheld that ruling on March 31, 2026. For how trade and supply chains are shaping warehouse demand, see How Tariffs Are Reshaping Warehouse Demand in 2026.
3. Suburban Maryland’s New Supply Landed in Frederick County
Frederick County delivered 508,639 SF this year, 88% of Suburban Maryland’s new supply, and its vacancy is 27.1%. How fast that space leases will shape the region’s vacancy rate more than any other single factor. For the national small-bay versus big-box picture, see Small-Bay vs. Big-Box: What the Vacancy Gap Means for Tenants and Operators.
Outlook: What to Watch in Q4 2026
C&W’s Q3 2026 MarketBeats are due in mid-October, with the year-end release to follow. Three readings matter most.
Watch whether Northern Virginia absorption turns positive. It stands at −65,749 SF year to date. C&W notes that availability remains constrained in core logistics corridors, so a return to gains depends on backfilling the Route 28 North and Springfield/I-95 move-outs.
Watch whether Frederick County leases up. At 27.1% vacancy, it pulls Suburban Maryland’s rate to 11.0%. Continued occupancy gains there would bring the market rate down.
Watch whether the rent split holds. Northern Virginia rents rose to $17.44/SF/yr while Suburban Maryland’s are down on the year. A third quarter of divergence would widen the gap between the two markets.
Find warehouse space in Washington DC
Browse co-warehousing, small-bay, and flex listings across the DC metro area.
Data sources: Cushman & Wakefield Northern Virginia Industrial MarketBeat Q2 2026 and Q1 2026; Cushman & Wakefield Suburban Maryland Industrial MarketBeat Q2 2026 and Q1 2026 (rents weighted net asking, $/SF/yr); Cushman & Wakefield U.S. Industrial MarketBeat Q2 2026 (U.S. vacancy); Commercial Observer, March 16, 2026, citing CommercialSearch (pipeline including data centers); Virginia Business, November 18, 2025 (Amazon land purchase); WTOP/InsideNoVa, April 2026 (PW Digital Gateway rulings). Each report reflects the most recent vacancy, rental, and construction data available at the time of publication. We refresh our reports as new market data is released, and we’re continually expanding coverage to additional metros.
Related Resources
Frequently Asked Questions
What is the current industrial vacancy rate in Washington DC?
Cushman & Wakefield reports the DMV as two markets. In Q2 2026, Northern Virginia industrial vacancy was 5.0% and Suburban Maryland’s was 11.0%. Combining the two reports gives 7.8% (WareCRE calculation: 8,986,050 vacant SF out of 115,055,969 SF), compared with C&W’s U.S. average of 6.9%.
How much does warehouse space cost in Washington DC?
In Q2 2026 the average asking rent was $17.44/SF/yr net in Northern Virginia and $15.16/SF/yr net in Suburban Maryland. Warehouse/distribution space averaged $16.70 in Northern Virginia and $14.54 in Suburban Maryland. Warehouse rents range from $13.94 in Prince George’s County to $19.29 in Route 28 Corridor North.
Which DC-area submarket is best for warehouse space?
It depends on the requirement. Prince George’s County offers the lowest warehouse rents ($13.94/SF/yr) and absorbed 223,047 SF this year. Manassas is the lowest-cost Northern Virginia submarket at $14.84/SF/yr but only 2.2% vacant. Route 28 Corridor North near Dulles is the premium option at $19.29/SF/yr. Frederick County has the most available space at 27.1% vacancy.
How much industrial space is under construction in the DC area?
C&W counts 647,493 SF under construction in Northern Virginia and 538,818 SF in Suburban Maryland at the end of Q2 2026. CommercialSearch, which includes data centers as industrial space, reported 13.2 million SF under way across the region in March 2026, nearly half of it data center space.