Phoenix Industrial & Warehouse Market Report | Q2 2026
Key Takeaways
- Phoenix industrial vacancy fell to 10.8% in Q2 2026, down 120 basis points from the prior quarter and 240 basis points year over year, as the metro absorbed 6.1 million SF against a 450.4 million SF inventory base.
- Overall asking rents rose to $1.12/SF/month NNN ($13.44/SF/year), up 2.8% quarter over quarter. Direct asking rents reached $1.15/SF/month. Cushman & Wakefield quotes the Phoenix metro on a monthly NNN basis.
- The Southwest Valley absorbed 5.1 million SF of the metro’s 6.1 million SF total, running 9.3% vacancy at $0.91/SF/month. The Northwest Valley is the tightest submarket at 7.7%; the Southeast Valley carries the highest vacancy at 16.4%.
- The construction pipeline re-expanded to 16.0 million SF, 59% speculative, up from 10.4 million SF in the prior quarter. Deliveries total 3.8 million SF year to date. Browse Phoenix warehouse listings on WareCRE.
10.8%
Overall Vacancy
$1.12
Avg. Asking Rent (NNN/SF/Mo)
6.1M
SF Absorbed (Q2 2026)
16.0M
SF Under Construction
Phoenix’s industrial warehouse market tightened again in Q2 2026. Net absorption of 6.1 million SF, up from 3.3 million SF in Q1, pulled overall vacancy down to 10.8%, a 120 basis point improvement on the quarter and 240 basis points below where the market stood a year ago. Warehouse and distribution product accounted for 96% of the quarter’s absorption, confirming that the recovery is being driven by bulk logistics demand rather than a broad-based lift across all product types.
Two things complicate the headline for occupiers. First, the demand is highly concentrated: the Southwest Valley alone accounted for 5.1 million SF of the 6.1 million SF absorbed. Second, the construction pipeline re-expanded sharply, from 10.4 million SF to 16.0 million SF under construction, with 59% of that space speculative. For businesses looking for warehouse space in Phoenix, the practical question is no longer whether the metro is recovering but which submarket and which building size you are competing in.
Market Snapshot: Q2 2026
| Metric | Q2 2026 | Change |
|---|---|---|
| Overall vacancy | 10.8% | ↓120 bps QoQ (12.0% a quarter earlier); ↓240 bps YoY |
| Overall asking rent | $1.12/SF/mo NNN | +2.8% QoQ from $1.09; equals $13.44/SF/year |
| Direct asking rent | $1.15/SF/mo NNN | Up from $1.13 a quarter earlier |
| Net absorption | 6.1M SF | Up from 3.3M SF; 96% warehouse/distribution |
| Leasing activity | 7.7M SF | +2.1% QoQ from 7.3M SF; 15.2M SF year to date |
| Under construction | 16.0M SF | 59% speculative; up from 10.4M SF |
| Deliveries | 3.8M SF YTD | Year-to-date basis; no quarter-only figure published |
| Total inventory | 450.4M SF | Base for all vacancy and absorption figures above |
All figures above are Cushman & Wakefield Phoenix MarketBeat data for Q2 2026. Rents are quoted on a monthly NNN basis, which is the convention Cushman & Wakefield uses for the Phoenix metro; annual equivalents are shown in parentheses throughout this report. Comparing Phoenix quotes against annual-basis markets without converting will overstate the gap by a factor of twelve.
Rent Trends: Monthly NNN, Rising Off a Tightening Base
Overall asking rents reached $1.12/SF/month NNN ($13.44/SF/year), up 2.8% from $1.09/SF/month in the prior quarter. Direct asking rents, which exclude sublease space, sit higher at $1.15/SF/month NNN, up from $1.13. The spread between overall and direct pricing is the sublease discount, and it is narrow enough to suggest sublease inventory is not currently dictating market pricing.
Rent dispersion across the metro is wide. Big-box bulk product in the Southwest Valley asks $0.91/SF/month, while the Southeast Valley asks $1.20 and the Northwest Valley $1.19. The Airport submarket sits at $1.13. The pattern is consistent: the cheapest space per SF is the largest and furthest out, and infill or mid-box product carries the premium. Occupiers evaluating Phoenix on cost per SF alone will end up in the Southwest Valley by default, which may or may not match their drive-time requirements.
For Tenants
Leverage in Phoenix is now submarket-specific. At 16.4% vacancy, the Southeast Valley is the clearest tenant’s market in the metro and also the deepest pool of smaller units. At 7.7%, the Northwest Valley offers the least room to negotiate. The 16.0 million SF pipeline, 59% of it speculative, means big-box options should keep arriving through 2027, but that supply is not evenly distributed across the Valley. Browse Phoenix warehouse listings on WareCRE.
Construction: Pipeline Re-Expanding
Phoenix has 16.0 million SF under construction, up from 10.4 million SF in the prior quarter, with 59% of that space built on a speculative basis. Deliveries total 3.8 million SF year to date, well below the 15.2 million SF of leasing activity recorded over the same period, which is why vacancy fell even as the pipeline grew.
The re-expansion is the single most important number for anyone underwriting Phoenix. Absorption of 6.1 million SF in a quarter comfortably clears the current delivery run rate, but 16.0 million SF of construction, the majority of it unleased, will reach the market over the next several quarters. Whether vacancy keeps compressing depends on demand holding at or near the Q2 pace rather than reverting toward the 3.3 million SF the metro posted in the prior quarter.
For Operators
Two quarters of vacancy compression (240 basis points year over year) and 2.8% quarterly rent growth support holding rate on stabilized warehouse and distribution product. The caution is the 16.0 million SF pipeline at 59% speculative. Owners of Southeast Valley product face both the metro’s highest vacancy at 16.4% and its most fragmented demand, with roughly 200 leases year to date at an average of 14,298 SF, so lease-up there is a velocity exercise rather than a single-tenant one.
Submarket Breakdown
Southwest Valley
The metro’s engine in Q2 2026, absorbing 5.1 million SF of the 6.1 million SF metro total. At 204.7 million SF, it is the largest submarket in the Valley and the center of big-box bulk distribution. Vacancy is 9.3% and overall asking rents are $0.91/SF/month NNN, the lowest in the metro. Burlington’s 2.2 million SF lease landed here. Leasing runs to large units: roughly 100 leases year to date at an average of 94,423 SF.
Southeast Valley
The highest vacancy in the metro at 16.4%, with overall asking rents of $1.20/SF/month NNN, the highest of the four major submarkets. Demand here is anchored in advanced manufacturing and the EV supply chain, including LG Energy Solution’s 1.5 million SF commitment. It is also where small-tenant demand concentrates: roughly 200 leases year to date at an average of 14,298 SF.
Airport
Phoenix’s infill, last-touch submarket at 69.9 million SF, with 10.3% vacancy and $1.13/SF/month NNN asking rents. It was the one soft spot in the quarter, giving back 234,677 SF of occupancy. Central location and last-touch access remain the draw for tenants that need to serve the metro population rather than a regional distribution radius.
Northwest Valley
The tightest submarket in the metro at 7.7% vacancy, with asking rents of $1.19/SF/month NNN. Mid-box product is the story here and it is tightening. DHL’s 1.18 million SF lease on Northern Parkway was the standout transaction of the quarter in this corridor.
| Submarket | Vacancy | Asking Rent (NNN/SF/Mo) | Q2 2026 Profile |
|---|---|---|---|
| Southwest Valley | 9.3% | $0.91 | 204.7M SF; big-box bulk; absorbed 5.1M SF |
| Southeast Valley | 16.4% | $1.20 | Highest vacancy; advanced mfg and EV supply chain |
| Airport | 10.3% | $1.13 | 69.9M SF; infill last-touch; gave back 234,677 SF |
| Northwest Valley | 7.7% | $1.19 | Tightest in metro; tightening mid-box |
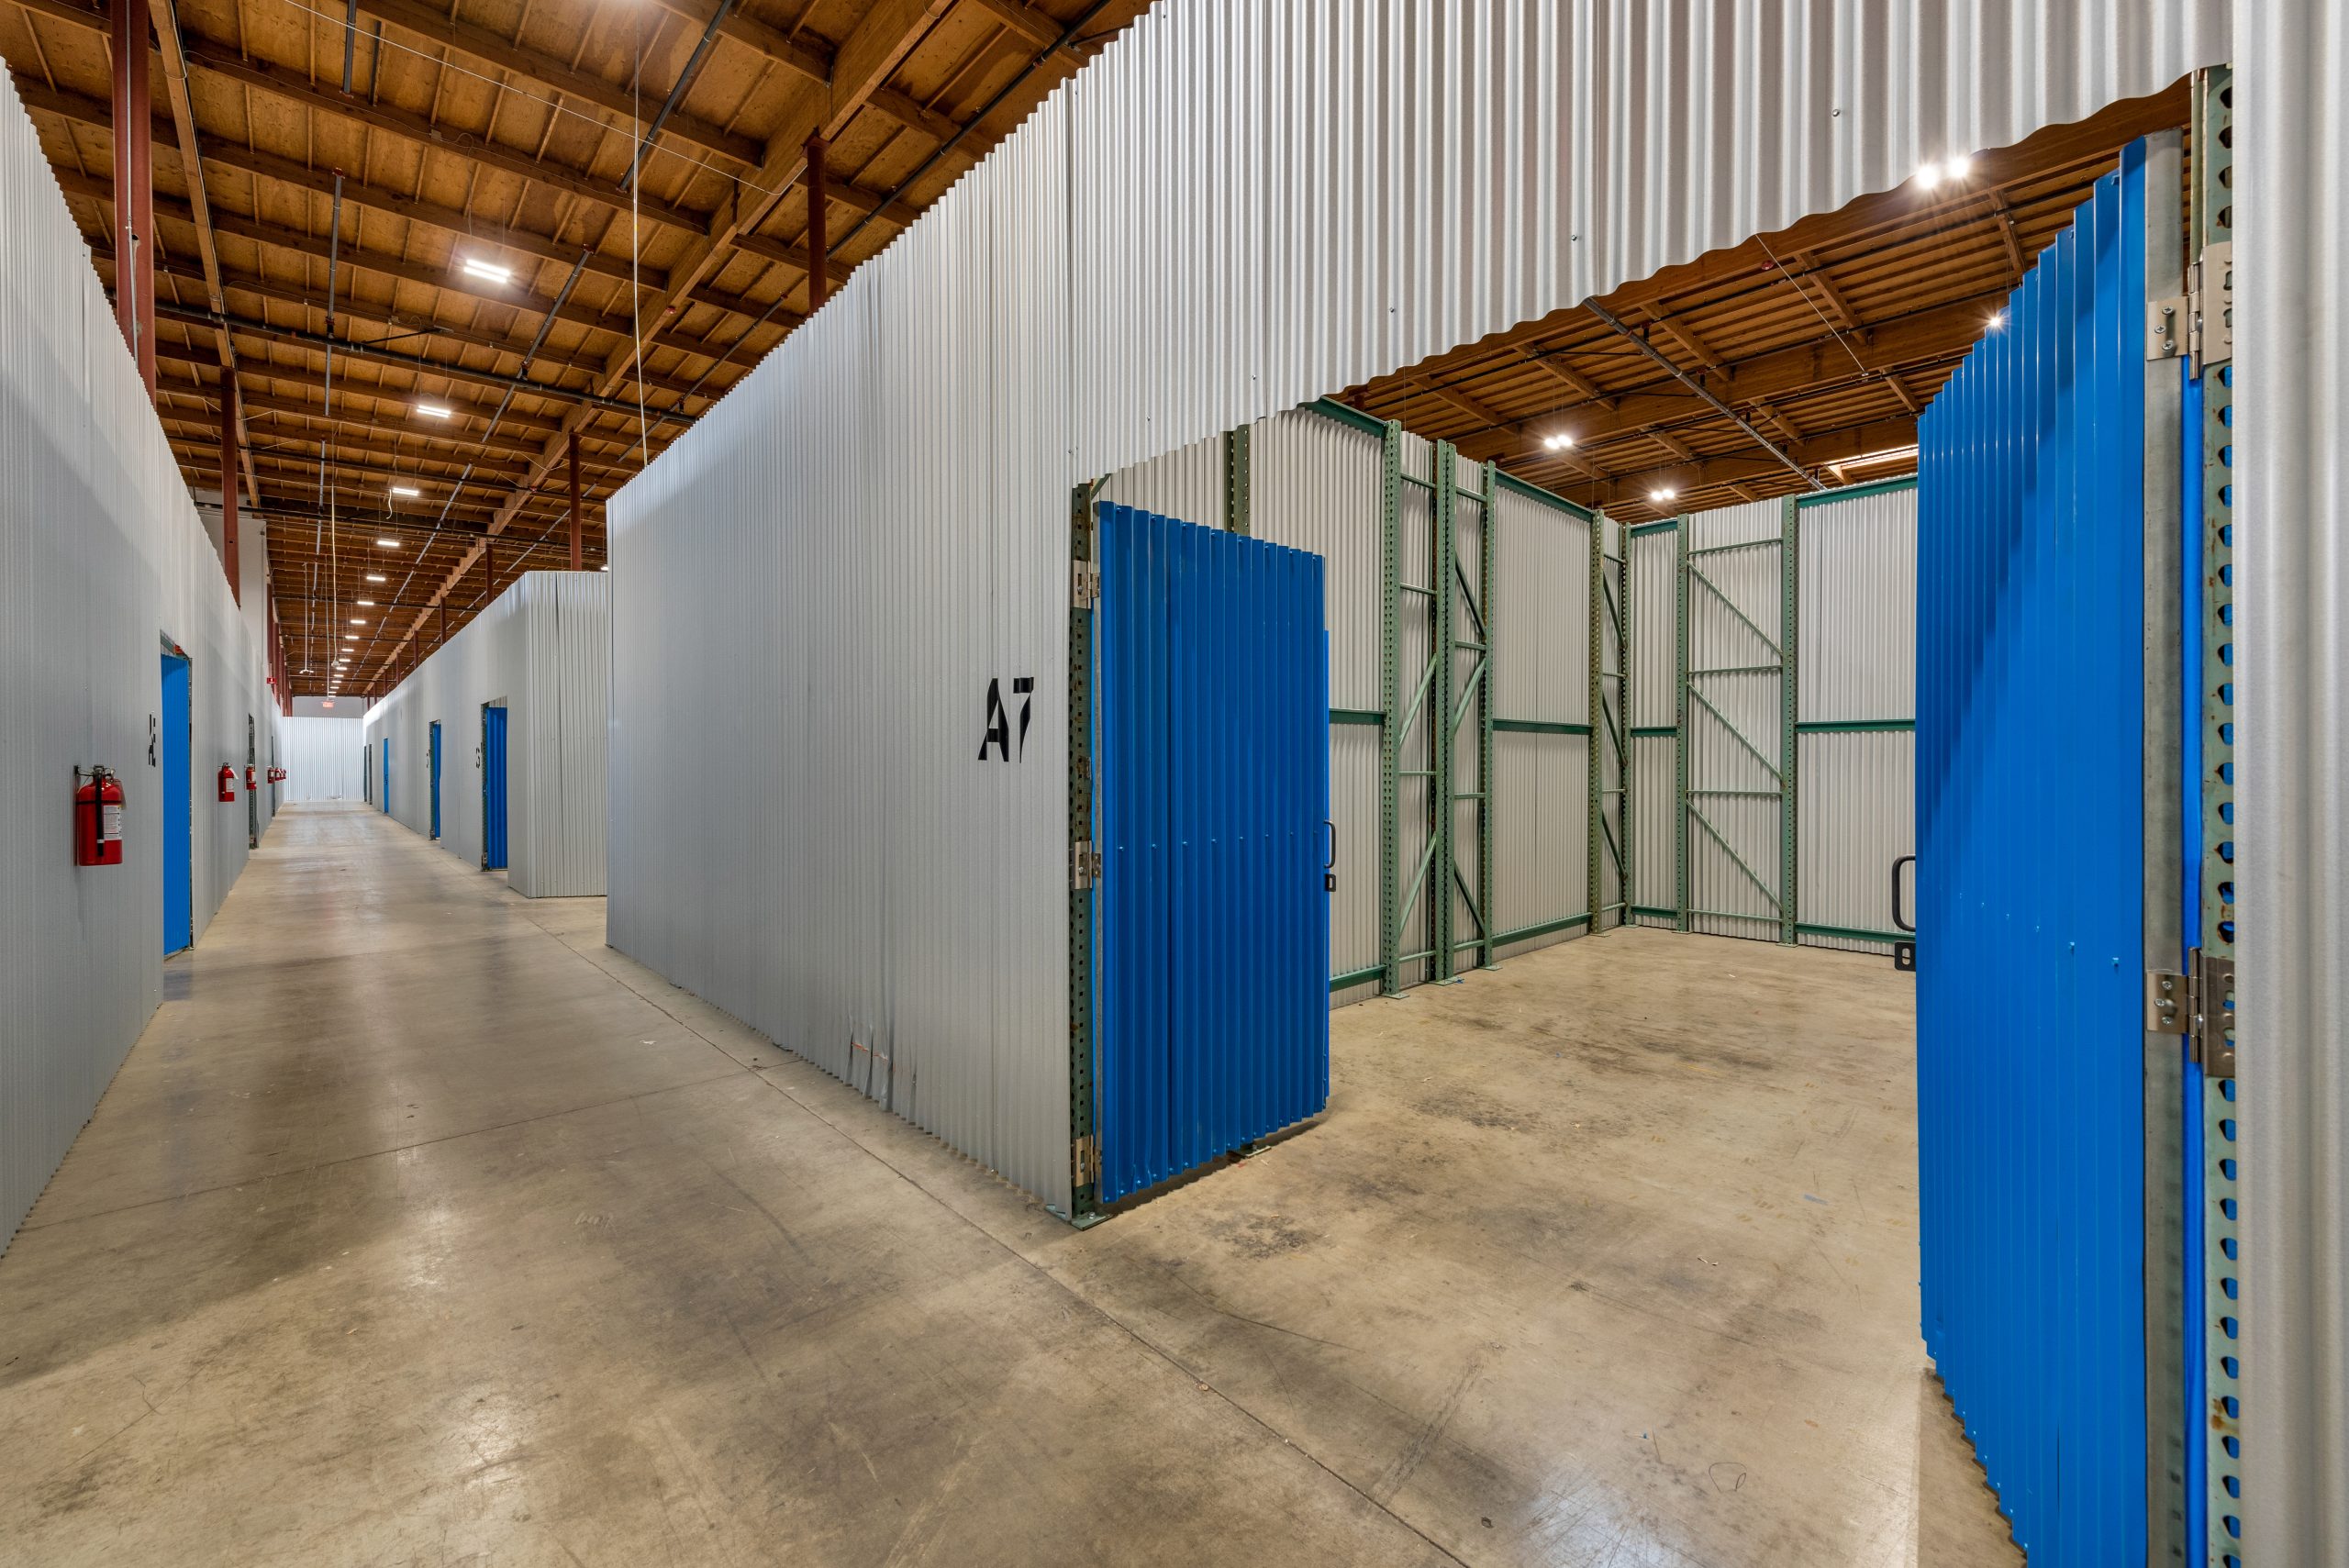
Co-Warehousing & Flexible Warehouse Space in Phoenix
Phoenix’s small-tenant demand is geographically concentrated, and the lease-count data shows it clearly. The Southeast Valley signed roughly 200 leases year to date at an average of 14,298 SF. The Southwest Valley signed roughly 100 at an average of 94,423 SF. Two submarkets, similar quarters on paper, entirely different tenant profiles: one is a small-bay and mid-bay market by volume, the other is a big-box market by square footage.
What that means for smaller occupiers: the Southeast Valley is where flexible, small-format requirements are being met at scale, and where 16.4% vacancy gives smaller tenants unusual negotiating room for a growing metro. Advanced manufacturing and EV supply chain activity in that corridor also generates a steady stream of vendor, staging, and overflow requirements that fit the co-warehousing and small-bay format rather than a bulk distribution box.
Browse available co-warehousing and small-bay listings on WareCRE’s Phoenix marketplace.
Looking for warehouse space in Phoenix?
Key Trends to Watch
1. Bulk Logistics Is Carrying the Recovery
Warehouse and distribution product accounted for 96% of Q2 2026 net absorption. That is a narrow base for a 6.1 million SF quarter, and it means the metro’s vacancy trajectory is effectively a bet on bulk logistics demand. Burlington’s 2.2 million SF lease in the Southwest Valley and DHL’s 1.18 million SF lease on Northern Parkway illustrate the deal profile driving the number. For national context, see How Tariffs Are Reshaping Warehouse Demand in 2026.
2. Demand Is Concentrated in One Submarket
The Southwest Valley absorbed 5.1 million SF of the metro’s 6.1 million SF. Strip that submarket out and the remainder of the Valley accounted for what was left, with the Airport submarket giving back 234,677 SF. Metro-level vacancy of 10.8% is an accurate figure and a poor guide to conditions in any specific corridor, where the range runs from 7.7% to 16.4%.
3. The Small-Bay and Big-Box Split Runs Along Submarket Lines
Phoenix’s size bifurcation is geographic. The Southeast Valley averaged 14,298 SF per lease year to date across roughly 200 leases; the Southwest Valley averaged 94,423 SF across roughly 100. A tenant sized near the Southeast Valley average is effectively shopping a different market than one sized near the Southwest Valley average, with different vacancy, different pricing, and different landlords. See Small-Bay vs. Big-Box: What the Vacancy Gap Means.
4. The Pipeline Turned Back Up
Under construction volume moved from 10.4 million SF to 16.0 million SF in a single quarter, with 59% speculative. Developers are responding to the same absorption strength that drove vacancy down, which is how supply cycles restart. The 3.8 million SF delivered year to date is the last quiet reading before that pipeline begins landing.
Outlook: What to Watch in Q3–Q4 2026
Phoenix enters the second half of 2026 with genuine momentum and a visible supply risk. Vacancy has fallen 240 basis points year over year, absorption more than doubled quarter over quarter, and leasing activity reached 15.2 million SF year to date. The pipeline re-expansion is the counterweight.
Vacancy direction depends on absorption durability. At the Q2 pace of 6.1 million SF, the metro can absorb the 16.0 million SF pipeline without difficulty. At the prior quarter’s 3.3 million SF pace, 59% speculative construction becomes a vacancy problem in 2027 rather than a 2026 one.
Expect rent growth to stay uneven. Overall asking rents grew 2.8% on the quarter to $1.12/SF/month, but the submarket spread from $0.91 to $1.20 is where the actual pricing decisions sit. Mid-box product in the Northwest Valley, at 7.7% vacancy, has the least reason to concede.
Watch the Airport submarket. It gave back 234,677 SF in Q2 while the metro absorbed 6.1 million SF. A second consecutive quarter of negative absorption in infill last-touch space would signal something different from a big-box supply story, and it is the reading most worth tracking into Q4.
Find warehouse space in Phoenix
Browse co-warehousing, small-bay, and flex listings across the Phoenix metro.
Data sources: Cushman & Wakefield Phoenix MarketBeat Q2 2026 (metro rents quoted monthly NNN), Kidder Mathews Phoenix 2Q26 (11.4% total vacancy and $1.18/SF/month direct asking, measured against an inventory base roughly 15 million SF larger, which accounts for most of the difference), WareCRE marketplace data. Each report reflects the most recent vacancy, rental, and construction data available at the time of publication. We refresh our reports as new market data is released, and we’re continually expanding coverage to additional metros.
Related Resources
Frequently Asked Questions
What is the current industrial vacancy rate in Phoenix?
Phoenix industrial vacancy is 10.8% as of Q2 2026 per Cushman & Wakefield, down 120 basis points on the quarter and 240 basis points year over year. Submarket vacancy ranges from 7.7% in the Northwest Valley to 16.4% in the Southeast Valley, so the metro figure is a poor proxy for conditions in any single corridor.
How much does warehouse space cost in Phoenix?
Overall asking rents are $1.12/SF/month NNN as of Q2 2026 ($13.44/SF/year), up 2.8% on the quarter. Direct asking rents are $1.15/SF/month. By submarket, rents run from $0.91/SF/month in the Southwest Valley to $1.20 in the Southeast Valley, with the Airport submarket at $1.13 and the Northwest Valley at $1.19. Cushman & Wakefield quotes Phoenix on a monthly NNN basis.
Which Phoenix submarket is best for warehouse space?
It depends on size. The Southwest Valley is the big-box market, 204.7 million SF of mostly bulk distribution at 9.3% vacancy and the metro’s lowest rents of $0.91/SF/month. The Southeast Valley suits smaller requirements, averaging 14,298 SF per lease year to date with the metro’s highest vacancy at 16.4%. The Airport submarket serves infill and last-touch users, and the Northwest Valley is the tightest at 7.7%.
How much industrial space is under construction in Phoenix?
Phoenix has 16.0 million SF under construction as of Q2 2026, 59% of it speculative, up from 10.4 million SF the prior quarter. Deliveries total 3.8 million SF year to date against 15.2 million SF of year-to-date leasing activity, which is why vacancy fell even as the pipeline grew. That pipeline is the main risk to further vacancy compression if absorption slows from its Q2 pace.