Austin Industrial & Warehouse Market Report | Q1 2026
Key Takeaways
- Austin’s industrial warehouse market is working through the most significant oversupply in its history. Vacancy reached 14.5–15.8% in Q1 2026 as massive speculative construction delivered into moderating demand.
- Net absorption remains positive at 700,000–800,000 SF in Q1 2026, indicating the market is actively absorbing new supply. Leasing totaled 2.5 million SF, with advanced manufacturing leading demand.
- Asking rents range from $12.60–$14.43/SF NNN depending on source and submarket, with modest downward pressure as landlords compete for tenants. This is the most tenant-favorable environment Austin has seen in over a decade.
- The construction pipeline is contracting, down to 7.5 million SF from 8.8 million SF, and new starts are moderating. Samsung, Flextronics, and advanced manufacturing anchor long-term demand. Browse Austin warehouse listings on WareCRE.
15.8%
Overall Vacancy
$14.17
Avg. Asking Rent (NNN/SF)
+700K
SF Absorbed Q1
7.5M
SF Under Construction
Austin’s industrial warehouse market is deep in correction territory, and for tenants, that’s a significant opportunity. A surge of speculative construction that more than tripled the metro’s industrial inventory since 2022 has pushed vacancy to levels not seen in two decades. Landlords are competing aggressively for tenants with concessions, flexible terms, and rate reductions.
But don’t mistake oversupply for weakness. Austin is still one of the fastest-growing metros in the US (adding ~43,000 residents annually), home to Samsung’s semiconductor operations, Tesla’s Gigafactory, and a growing advanced manufacturing ecosystem. The construction pipeline is contracting, absorption is positive, and the market is working its way back to balance. For businesses evaluating Texas industrial options, Austin offers a unique combination of tenant leverage and long-term growth potential.
Market Snapshot: Q1 2026
| Metric | Q1 2026 | Change |
|---|---|---|
| Overall vacancy | 14.5–15.8% | +220 bps YoY, pace slowing |
| Avg. asking rent (NNN) | $12.60–$14.43/SF | -1 to -5% YoY |
| Q1 net absorption | +700K–800K SF | Positive but moderating |
| TTM net absorption | 3.7M SF | – |
| Q1 leasing volume | 2.5M SF | -16.5% YoY |
| Under construction | 7.5M SF | Down from 8.8M SF |
| Population growth | ~43K/year | Among strongest nationally |
Rent Trends: Tenant Leverage at Its Peak
Asking rents have come under downward pressure, ranging from $12.60–$14.43/SF NNN depending on submarket and source. Logistics space is seeing the steepest correction, while South and Central Austin command the highest rates. Landlords are offering concessions that would have been unthinkable in 2023: elevated rent abatement, TI allowances, and shorter lease terms.
The rent decline is modest compared to the vacancy spike because Austin’s cost basis for new construction is high and landlords are holding face rates while conceding on effective economics. For tenants, the real savings are in the deal terms, not just the asking rate.
For Tenants
Austin is the most tenant-favorable industrial market in Texas right now. You have options, leverage, and concessions that don’t exist in Dallas-Fort Worth or Houston. If you need Texas warehouse space and don’t require port access, Austin’s combination of favorable terms and long-term growth story is compelling. Browse Austin warehouse listings on WareCRE.
Submarket Breakdown
South Austin / I-35 Corridor
The highest-rent submarket, commanding premium rates driven by Tesla Gigafactory proximity and population density. Modern distribution and manufacturing product in good demand. Vacancy is below the metro average here.
Central Austin
Infill industrial with limited new supply and strong small-bay demand. Rates are at the top of the market due to urban proximity and zoning scarcity. Small-bay and flex space stays tight even as the broader market softens.
North Austin / Williamson County / Georgetown
Where the bulk of new speculative construction has landed. Georgetown posted the highest vacancy in the metro at 28.4%, reflecting aggressive spec development outrunning demand. Rates are more competitive and concessions are most available here. Samsung’s presence anchors the tech-industrial demand base.
Southeast / Bastrop County
The tightest submarket at just 3.7% vacancy. Limited new development and growing residential population create structural undersupply for small and mid-bay users. An emerging value alternative to the I-35 corridor.
| Submarket | Vacancy | Q1 2026 Profile |
|---|---|---|
| South Austin / I-35 | Below avg. | Premium, Tesla-adjacent |
| Central Austin | Below avg. | Infill, small-bay tight |
| North / Georgetown | 28.4% | Highest vacancy, best concessions |
| SE / Bastrop County | 3.7% | Tightest, emerging value play |
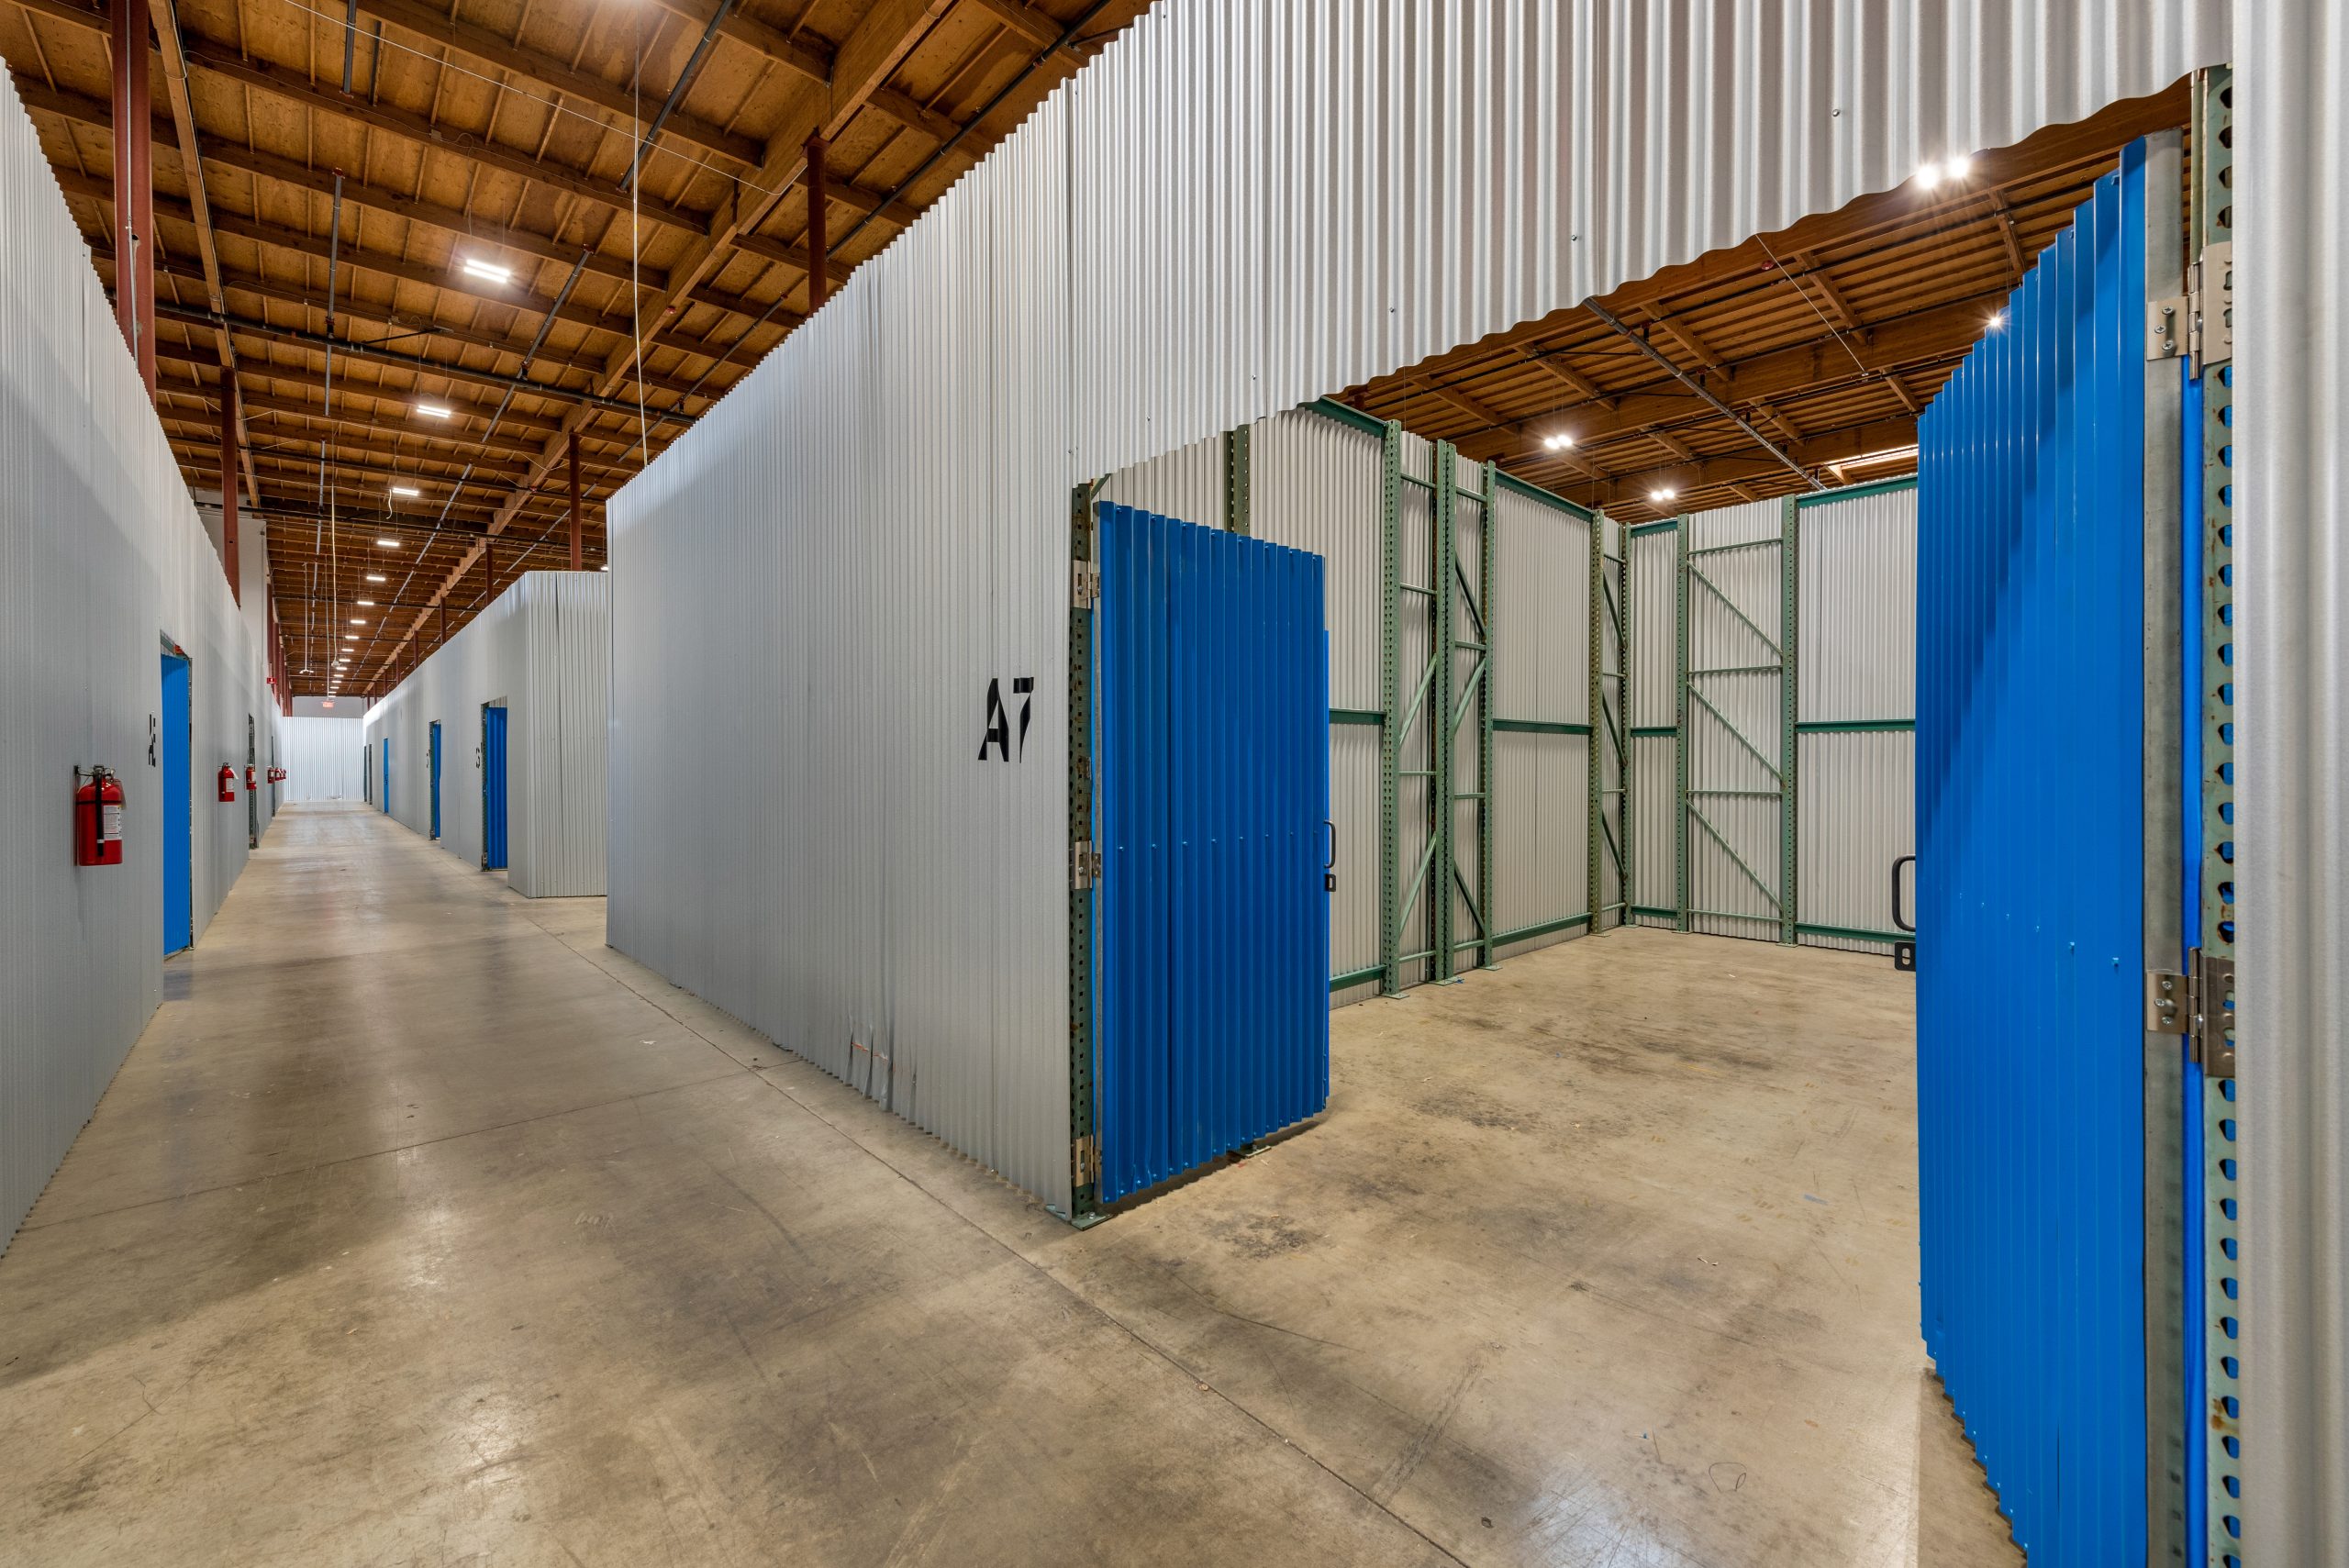
Co-Warehousing & Flexible Warehouse Space in Austin
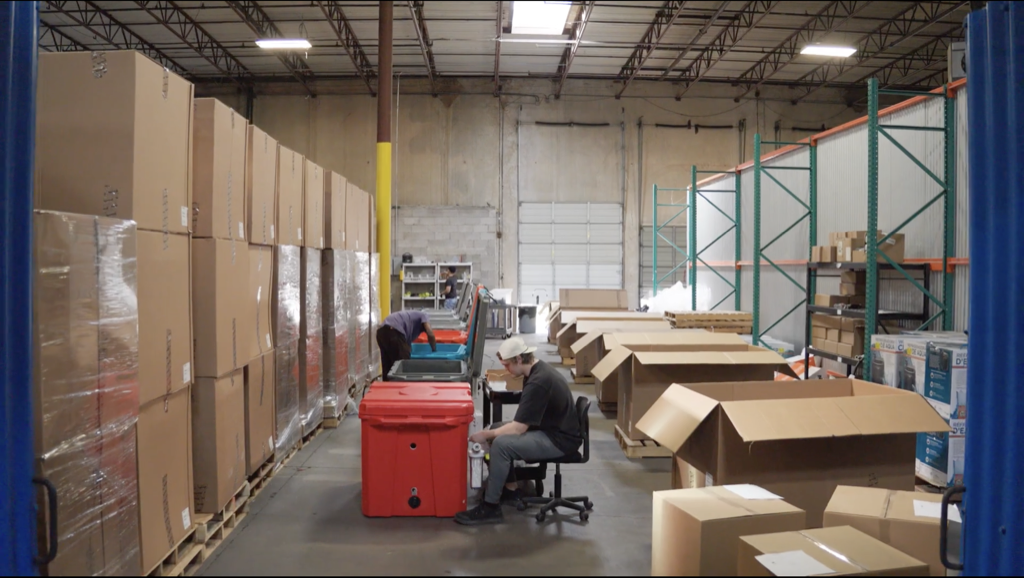
Austin’s co-warehousing market benefits from the city’s entrepreneurial culture and fast-growing SMB population. The same population growth driving residential demand creates steady need for small-format warehouse space from e-commerce operators, food producers, and tech hardware companies.
Browse available co-warehousing and small-bay listings on WareCRE’s Austin marketplace.
Looking for warehouse space in Austin?
Key Trends to Watch
1. Advanced Manufacturing Anchors Long-Term Demand
Samsung, Flextronics, Tesla, and a growing roster of advanced manufacturing tenants create industrial demand that is structural and distinct from the logistics-driven oversupply. Notable Q1 transactions include Baer Manufacturing and ZT Systems. Austin’s growing reputation as a tech-manufacturing hybrid market positions it uniquely among Texas metros. See Small-Bay vs. Big-Box: What the Vacancy Gap Means.
2. Pipeline Contraction Is the Recovery Catalyst
The construction pipeline has already begun shrinking (7.5M SF, down from 8.8M SF), and new starts are decelerating. As the remaining pipeline delivers over the next 12–18 months with fewer replacements behind it, the supply-demand balance will improve. This is the mechanism that will eventually compress vacancy. For tariff context, read How Tariffs Are Reshaping Warehouse Demand in 2026.
3. Population Growth Sustains Demand Floor
Austin continues adding approximately 43,000 residents per year, supporting consumer-driven demand for distribution, fulfillment, and last-mile operations. Williamson County is capturing a large share of residential growth, which will eventually support the industrial demand needed to absorb the spec space built in that corridor.
Outlook: What to Watch in Q2–Q3 2026
Austin is in mid-correction. Vacancy will likely stay elevated through 2026 as the remaining construction pipeline delivers, but the rate of increase is slowing and absorption is positive. The market is on a path to recovery. The question is timing, not direction.
Expect vacancy to plateau in the 15–17% range through mid-2026, then begin compressing as the pipeline thins. Bastrop County and Central Austin will tighten first; the Georgetown/North corridor will take the longest to rebalance.
Rents will stabilize before recovering. Concessions will remain available through 2026, particularly in North Austin. Tenants should take advantage now. When the pipeline dries up and population growth absorbs the surplus, the negotiating leverage will shift.
The biggest risk is that the pipeline stays elevated longer than expected, or that a broader economic slowdown reduces population in-migration. Austin’s cost of living, while still lower than coastal markets, has risen significantly, and any slowdown in tech hiring would reduce demand for both residential and industrial space.
Find warehouse space in Austin
Browse co-warehousing, small-bay, and flex listings across the Austin metro.
Data sources: Matthews Austin Industrial Q1 2026, Partners Real Estate Austin Q1 2026, Savills Austin Q1 2026 Industrial Report, CBRE Austin Industrial Figures Q1 2026, Colliers Austin Industrial Q1 2026, Avison Young Austin Industrial Market Report, WareCRE marketplace data (May 2026).
Related Resources
Frequently Asked Questions
What is the current industrial vacancy rate in Austin?
Austin’s overall industrial vacancy ranges from 14.5–15.8% as of Q1 2026, a 20-year high driven by massive speculative construction. However, vacancy varies dramatically by submarket. Bastrop County is just 3.7% while Georgetown exceeds 28%. The rate of increase is slowing as absorption holds positive.
How much does warehouse space cost in Austin?
Average asking rents in Austin range from $12.60–$14.43/SF NNN as of Q1 2026, with modest downward pressure year-over-year. South and Central Austin command the highest rates. Landlords are offering elevated concessions including rent abatement and TI allowances, making effective rents lower than face rates suggest.
Is now a good time to lease warehouse space in Austin?
Yes. This is the most tenant-favorable environment Austin has seen in over a decade. Elevated vacancy means more options, better concessions, and leverage to negotiate flexible terms. The construction pipeline is contracting, which means today’s favorable conditions won’t last indefinitely.
How does Austin compare to Dallas and Houston for warehouse space?
Austin has the highest vacancy and most tenant-favorable conditions of any major Texas market. Dallas-Fort Worth and Houston are larger markets with stronger logistics infrastructure, but Austin offers the best concession environment and a unique advanced manufacturing demand base anchored by Samsung and Tesla. For port access, Houston is essential. For national distribution, DFW is dominant. For tenant leverage with growth potential, Austin stands out.