Houston Industrial & Warehouse Market Report | Q2 2026
Key Takeaways
- Houston industrial vacancy rose 30 basis points to 6.3% in Q2 2026 as 8.6 million SF of new supply delivered, the most in a quarter since 2023. Vacancy is unchanged from a year earlier.
- Net absorption kept pace, reaching 6.7 million SF in Q2 and 11.9 million SF in the first half, more than triple the 3.7 million SF of the first half of 2025.
- Overall asking rents rose to $7.87/SF/yr NNN, up 2.2% on the quarter and 5.0% on the year. Warehouse/distribution space asks $7.67/SF/yr.
- 23.0 million SF is under construction, more than 93% of it speculative, concentrated in the North and Northwest.
Browse warehouse space for rent in Houston
6.3%
Overall Vacancy (Q2 2026)
$7.87
Avg. Asking Rent ($/SF/yr NNN)
6.7M
SF Net Absorption (Q2 2026)
23.0M
SF Under Construction
Houston delivered 8.6 million SF of new industrial space in Q2 2026 and absorbed 6.7 million SF, up from 5.2 million SF in Q1 as restated. Supply ran ahead of demand, so vacancy rose 30 basis points to 6.3%, but rents still climbed. The market is healthy on demand and heavy on speculative supply, and the balance between the two will set the direction for the rest of 2026.
Figures are from Cushman & Wakefield’s Q2 2026 Houston Industrial MarketBeat unless noted. Prior-quarter and year-ago comparisons use the figures as restated in C&W’s Q2 2026 U.S. Industrial MarketBeat tables. Rents are net asking, quoted in $/SF/yr. Other data providers measure Houston differently. CoStar-based figures published by Matthews put Q2 2026 vacancy at 7.3%. Those figures are not comparable with C&W’s and are not blended here.
Market Snapshot: Q2 2026
| Metric | Q2 2026 | Q1 2026 (restated) | YoY or note |
|---|---|---|---|
| Overall vacancy | 6.3% | 6.0% | Unchanged YoY (6.3% in Q2 2025) |
| Overall asking rent ($/SF/yr NNN) | $7.87 | $7.70 | +5.0% YoY (from $7.49) |
| Warehouse/distribution asking rent ($/SF/yr) | $7.67 | n/a | +2.5% QoQ; +3.9% YoY |
| Net absorption | 6.7M SF | 5.2M SF | 11.9M SF year to date |
| Leasing activity | 8.3M SF | n/a | 17.4M SF year to date, +17.2% YoY |
| Deliveries | 8.6M SF | n/a | 14.3M SF year to date |
| Under construction | 23.0M SF | n/a | More than 93% speculative |
| Sublease availability | 4.5M SF | n/a | 0.7% of inventory |
| Inventory | 613.6M SF | n/a | Base for all rates above |
Source: Cushman & Wakefield, Houston Industrial MarketBeat Q2 2026. Q1 2026 and Q2 2025 values as restated in C&W’s U.S. Industrial MarketBeat Q2 2026 metro tables. n/a = not restated in the Q2 reports.
Rent Trends: Up 2.2% on the Quarter to $7.87/SF
Houston’s overall asking rent reached $7.87/SF/yr NNN in Q2 2026, up 2.2% from the prior quarter and 5.0% year over year. Warehouse/distribution space, the largest segment, asks $7.67/SF/yr, up 2.5% on the quarter. Manufacturing space averages $8.06/SF/yr and office service/flex $11.49/SF/yr. Houston remains well below the U.S. overall average of $10.32/SF/yr.
Growth is uneven. The South ($9.24/SF/yr), West ($8.99) and Southwest ($8.57) command the highest overall asking rents, and the South (16.7%), West (15.7%) and North (12.0%) posted the strongest annual rent growth. Data sources disagree on direction. Matthews, citing CoStar data, reported annual asking rent growth of −0.8% for Q2 2026 on its broader measure. Tenants should check the specific submarket and building class rather than rely on a metro average.
For Tenants
Leverage depends on size and location. More than 93% of the 23.0 million SF pipeline is speculative, and 8.6 million SF delivered in Q2 alone, so large-format tenants have new options coming, especially in the North and Northwest. The Southwest, at 2.6% vacancy, is the tightest cluster; expect less room to negotiate there. Search Houston warehouse listings on WareCRE.
Construction Pipeline: 23.0M SF Underway, Mostly Speculative
Houston had 23.0 million SF under construction at the end of Q2 2026. That is down from the prior quarter but well above the 13.3 million SF quarterly average of 2024 and 2025. The North (6.2 million SF) and Northwest (5.9 million SF) account for more than half of the space underway, and more than 93% of the pipeline is speculative.
Deliveries reached 8.6 million SF in Q2, the strongest quarter for new supply since 2023, bringing the year-to-date total to 14.3 million SF. The largest completions were Prologis Legacy Point Building 1 (1.0 million SF) and Innerbelt Northwest Logistics Building 5 (955,460 SF), both in the Northwest-Far submarket. Sublease availability is modest at 4.5 million SF, 0.7% of inventory.
For Operators
Rents are still rising on C&W’s measure, but C&W expects vacancy to see “continued upward pressure into 2027 as new deliveries reach the market,” and rent growth in the top-performing submarkets to moderate in 2027. With most of the pipeline speculative, owners of big-box product in the North and Northwest should weigh occupancy against rate. Modern, well-located product is where C&W expects landlords to retain pricing power.
Submarket Breakdown: Northwest Leads Demand, Southeast Is the Softest
C&W groups Houston into seven main submarket clusters. The four largest by inventory are below, followed by a table covering all seven.
Northwest
Houston’s largest cluster at 151.9 million SF and the quarter’s demand leader, with roughly 2.5 million SF of net absorption in Q2 and just over 3.6 million SF year to date. It also led leasing with 2.0 million SF. Vacancy is 5.8%, warehouse space asks $8.17/SF/yr, and 5.9 million SF is under construction, including along the Hwy 290 corridor.
Southeast / Port Houston & Bayport
The port-driven cluster serving Port Houston’s Bayport and Barbours Cut terminals and the petrochemical complex. At 141.7 million SF it is the second-largest cluster and the loosest, with 9.3% vacancy overall and 11.6% in Southeast-Far. Warehouse space asks $7.24/SF/yr, the lowest of the four, and 3.7 million SF is under construction.
North / I-45 North
103.4 million SF of big-box distribution with connectivity north toward Dallas. Vacancy is 5.5% and warehouse rents average $8.20/SF/yr. The North has the largest pipeline of any cluster at 6.2 million SF, and its 12.0% annual rent growth ranks third among the clusters. It absorbed 1.8 million SF in the first half.
Southwest / Sugar Land
The tightest of the major clusters at 2.6% vacancy, serving Fort Bend County and the southwestern suburbs across 69.3 million SF. Overall asking rents average $8.57/SF/yr and warehouse rents $8.21. It absorbed 1.8 million SF in the first half. Applied Optoelectronics’ 343,332 SF lease at Hightower Business Park was one of the quarter’s largest deals.
| Submarket cluster | Vacancy | W/D Asking Rent ($/SF/yr) | YTD Net Absorption (SF) | Under Construction (SF) |
|---|---|---|---|---|
| Northwest | 5.8% | $8.17 | 3,678,768 | 5,933,392 |
| Southeast | 9.3% | $7.24 | 960,236 | 3,657,747 |
| North | 5.5% | $8.20 | 1,779,671 | 6,181,594 |
| Southwest | 2.6% | $8.21 | 1,823,186 | 2,244,967 |
| South | 6.7% | $8.80 | 1,429,380 | 4,287,746 |
| West | 4.5% | $8.21 | 1,182,336 | 0 |
| Northeast | 7.8% | $6.76 | 1,037,906 | 678,616 |
| Houston total | 6.3% | $7.67 | 11,891,483 | 22,984,062 |
Source: Cushman & Wakefield, Houston Industrial MarketBeat Q2 2026, market statistics table (cluster rows).
Co-Warehousing & Flexible Warehouse Space in Houston
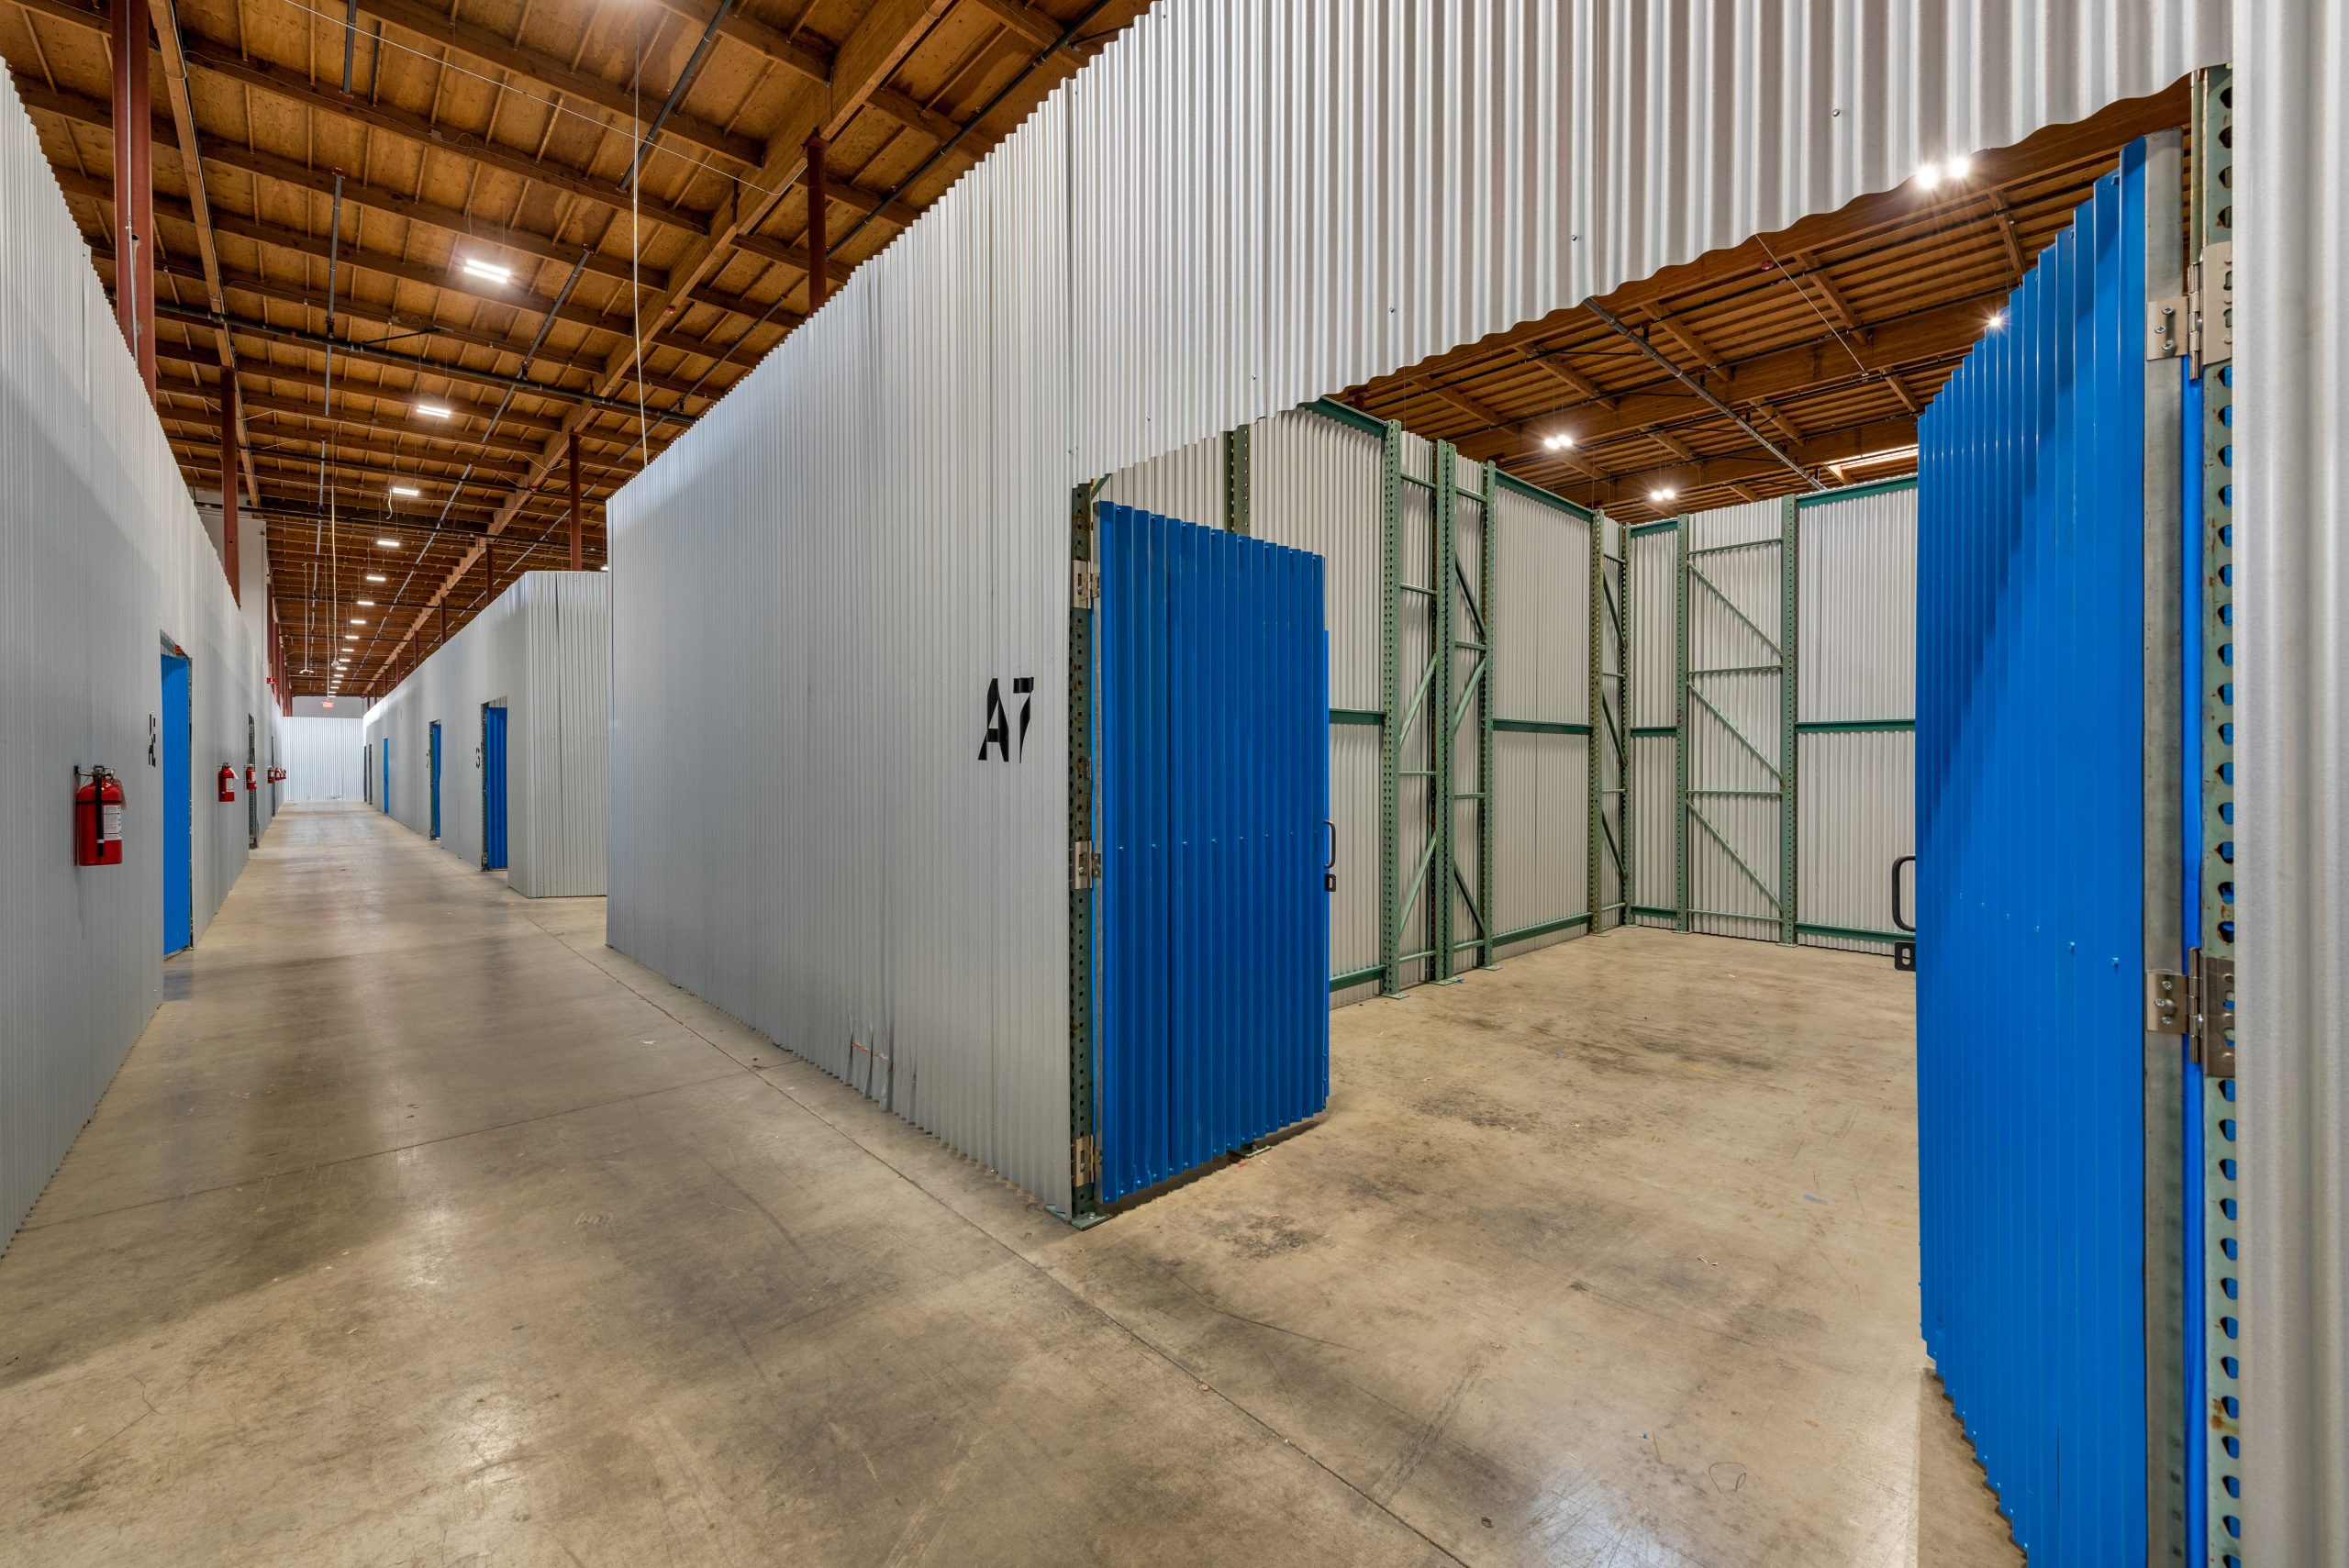
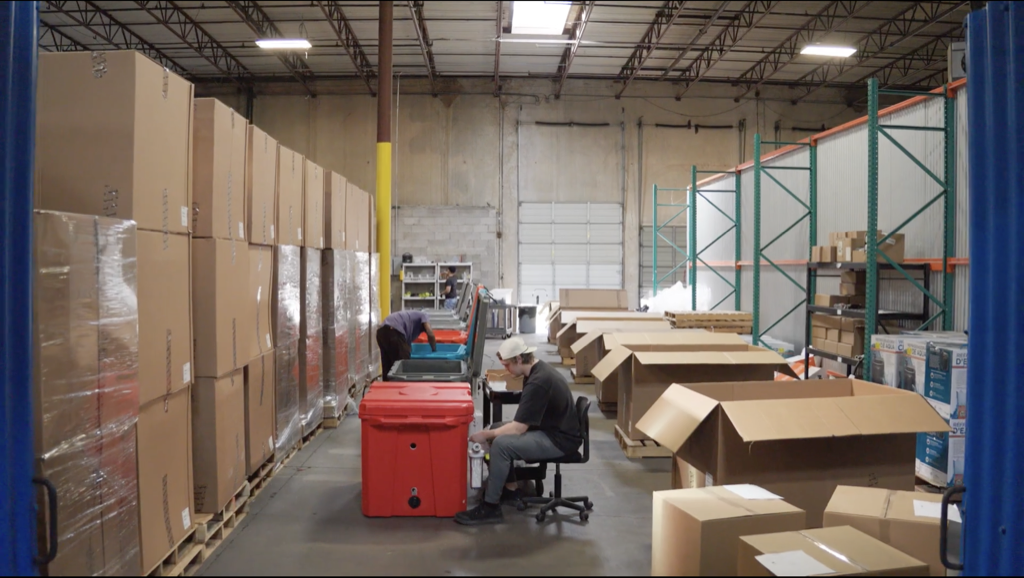
Small-bay and flex space in Houston serves contractors, distributors and service businesses that need operating space in smaller increments than the speculative big-box wave offers. A large small-business base, a growing population and the Gulf Coast trade and energy economy keep that demand steady. Office service/flex space averages $11.49/SF/yr in C&W’s data, compared with $7.67/SF/yr for warehouse/distribution.
Houston’s flexible-space demand comes largely from e-commerce and last-mile operators, energy-services and oilfield suppliers, and building trades. Importers moving goods through Port Houston and regional food and beverage businesses round out the tenant base.
Browse available co-warehousing and small-bay warehouse listings on WareCRE’s Houston marketplace.
Looking for warehouse space in Houston?
Key Trends to Watch
1. Demand Is Strong but Trailing a Heavy Supply Wave
First-half absorption of 11.9 million SF was more than triple the 3.7 million SF of the first half of 2025, and C&W calls it Houston’s strongest first half in three years. Deliveries of 14.3 million SF over the same period still outran it, so vacancy rose.
2. Leasing Is Steady and Up 17.2% for the Half
Leasing held at 8.3 million SF in Q2, in line with the quarterly average since 2023, and reached 17.4 million SF for the half, up 17.2%. The largest new leases were Tesla (504,370 SF) at Kingsland Ranch Logistics Park in the West, Applied Optoelectronics (343,332 SF) in the Southwest, and Titanium Plus Autoparts (342,667 SF) and TAS Energy (321,172 SF) in the South. Read more: Small-Bay vs. Big-Box: What the Vacancy Gap Means in 2026.
3. The Port-Oriented Southeast Is the Loosest Cluster
At 9.3% vacancy, and 11.6% in Southeast-Far, the Southeast also has the lowest warehouse rents of the large clusters at $7.24/SF/yr. Port-linked users have the most negotiating room there, while the Southwest (2.6%) and West (4.5%) remain tight.
Outlook: What to Watch in Q4 2026
C&W’s Q3 2026 MarketBeats are due in mid-October, with the year-end release to follow. Three indicators in those reports will set Houston’s direction.
Absorption versus deliveries. C&W expects leasing to stay healthy into 2027 as large-format occupiers keep targeting Houston’s core distribution corridors. With 23.0 million SF still underway, any quarter of absorption below deliveries would push vacancy higher.
How far vacancy rises. C&W expects “continued upward pressure into 2027” and says sustained absorption will decide whether Houston avoids a more meaningful supply overhang. Watch whether Q3 moves above the current 6.3%.
Diverging rent measures. C&W shows rents up 5.0% year over year, while CoStar-based figures from Matthews show a small annual decline. Watch whether C&W’s series starts to flatten, as C&W expects in the top-performing submarkets in 2027.
Find warehouse space in Houston
Browse co-warehousing, small-bay, and distribution listings across the Houston metro.
Data sources: Cushman & Wakefield Houston Industrial MarketBeat Q2 2026 (headline, submarket and product-type figures; rents net asking, $/SF/yr); Cushman & Wakefield U.S. Industrial MarketBeat Q2 2026 (restated Q1 2026 and Q2 2025 figures and U.S. averages; rents NNN); Matthews Houston Industrial Market Report Q2 2026, citing CoStar data (vacancy and rent-growth cross-check only); Matthews Houston Industrial Market Report Q1 2026, citing CoStar data (cap rate and sales volume only). Each report reflects the most recent vacancy, rental, and construction data available at the time of publication. We refresh our reports as new market data is released, and we’re continually expanding coverage to additional metros.
Related Resources
Frequently Asked Questions
What is the current industrial vacancy rate in Houston?
Houston industrial vacancy was 6.3% in Q2 2026, according to Cushman & Wakefield, up 30 basis points from Q1 and unchanged from a year earlier. By cluster, it ranges from 2.6% in the Southwest to 9.3% in the Southeast. The U.S. average in the same release was 6.9%.
How much does warehouse space cost in Houston?
The overall average asking rent was $7.87/SF/yr NNN in Q2 2026, up 5.0% year over year. Warehouse/distribution space averaged $7.67/SF/yr, manufacturing $8.06/SF/yr and office service/flex $11.49/SF/yr. The South, West and Southwest have the highest overall asking rents at $9.24, $8.99 and $8.57/SF/yr.
Which Houston submarket is best for warehouse space?
It depends on the requirement. The Northwest is the largest cluster and led demand in Q2. The North has the most new construction at 6.2 million SF. The Southeast, serving Port Houston, has the most availability at 9.3% vacancy and the lowest warehouse rents at $7.24/SF/yr. The Southwest is the tightest at 2.6%.
How much industrial space is under construction in Houston?
23.0 million SF was under construction at the end of Q2 2026, more than 93% of it speculative. The North (6.2 million SF) and Northwest (5.9 million SF) account for more than half. Deliveries reached 8.6 million SF in Q2 and 14.3 million SF year to date.
What are industrial cap rates in Houston?
Matthews, citing CoStar data, reported an average industrial cap rate of 7.7% in Q1 2026 on $77.1M of sales volume. Cushman & Wakefield’s Houston MarketBeat does not publish a cap rate.