Dallas-Fort Worth Industrial & Warehouse Market Report | Q1 2026
Key Takeaways
- Dallas-Fort Worth’s industrial warehouse market roared back in Q1 2026. Vacancy dropped below 10% for the first time since Q4 2023, settling at 8.7–8.8%, as 9.4–12.4 million SF of positive net absorption outpaced new deliveries. The market has definitively turned the corner from its oversupply cycle.
- Leasing activity hit record levels for a first quarter: 18.5–21 million SF of leases executed, driven heavily by third-party logistics (3PL) firms. Average asking rents reached $10.24/SF with 3.8% annual growth, reflecting moderating but persistent pricing power.
- The construction pipeline remains substantial at 28–31 million SF under construction, but 41% of that is pre-leased. More critically, demand is outpacing supply for the first time in years, 10.4 million SF absorbed against just 5.7 million SF delivered in Q1.
- DFW’s industrial vacancy has declined 137 basis points from its peak, signaling sustained recovery. Companies like Medline Industries, Amazon, Google, and DSV Contract Logistics drove major transactions. Browse Dallas warehouse listings on WareCRE.
8.7%
Overall Vacancy
$10.24
Avg. Asking Rent (NNN/SF)
21M
SF Leased (Q1, Record)
56M
SF Leased (2025 Full Year)
Dallas-Fort Worth is the largest industrial warehouse market in Texas and one of the biggest in the nation, with over 800 million SF of total inventory. After a challenging 2024 when speculative construction pushed vacancy above 10%, the market has decisively turned. Q1 2026 absorption outpaced deliveries by nearly 2:1, vacancy dropped below 10% for the first time in 18 months, and leasing hit record first-quarter volume. DFW’s structural advantages (central US geography, low costs, massive labor pool, and pro-business environment) are reasserting themselves.
For businesses looking for warehouse space in Dallas-Fort Worth, the window of peak tenant leverage is narrowing. Vacancy is compressing, pre-leasing on new construction is strong, and the market is returning to balance. But at 8.7%, there are still meaningful options, particularly in submarkets where spec product is completing lease-up. Here’s the full Q1 2026 picture.
Market Snapshot: Q1 2026
| Metric | Q1 2026 | Context |
|---|---|---|
| Overall vacancy | 8.7–8.8% | Below 10% first time since Q4 2023; ↓137 bps from peak |
| Avg. asking rent | $10.24/SF NNN | +3.8% YoY; at national avg. |
| Q1 net absorption | 9.4–12.4M SF | Demand outpacing supply ~2:1 |
| Q1 leasing volume | 18.5–21M SF | Record Q1; 3PL-driven |
| Under construction | 28–31M SF | ~41% pre-leased; pipeline dipping slightly |
| 2025 full-year leasing | 56.1M SF | 50%+ above long-term norms |
Rent Trends: Moderate Growth, National Average
Average asking rents reached $10.24/SF NNN in Q1 2026, with 3.8% annual growth, moderating from the aggressive rent increases of 2022–2023 but still positive. DFW rents sit right at the national average ($10.20/SF), reflecting the market’s position as a volume-driven logistics hub where cost competitiveness is the value proposition rather than scarcity premiums.
Demand is strongest in bulk logistics space, where large 3PL and distribution tenants continue to drive activity. Outer submarkets with modern inventory have captured the majority of demand, particularly for buildings exceeding 500,000 SF. Smaller-bay and shallow-bay product has seen softer demand, with sublease availability and concessions influencing leasing dynamics in this segment.
For Tenants
The tenant-favorable window is closing. Vacancy has dropped 137 bps from peak, absorption is outpacing deliveries 2:1, and pre-leasing on new construction is accelerating. If you’ve been evaluating DFW for distribution operations, Q2–Q3 2026 is likely the last period where you’ll have meaningful leverage on concessions. Rents at $10.24/SF are at the national average, competitive for a market of this scale and logistics quality. Search Dallas warehouse listings on WareCRE.
Construction Pipeline: Supply Slowing as Demand Accelerates
DFW’s construction pipeline stands at 28–31 million SF, with approximately 41% pre-leased. After years of aggressive speculative development, the pipeline is beginning to normalize. Deliveries in Q1 2026 totaled just 5.7 million SF, well below the absorption figure of 10.4+ million SF. This supply-demand dynamic is the primary driver behind declining vacancy.
The combination of slower deliveries and sustained demand is exactly what the market needed. DFW wrapped 2025 with 27.2 million SF of positive absorption and 56.1 million SF of total leasing, 50% above long-term norms. Major occupiers including Medline Industries, Amazon, Google, and DSV Contract Logistics (1 million SF lease) drove volume, reinforcing DFW’s position as a national distribution hub.
For Operators
The market has turned in your favor. Vacancy declining at 137 bps from peak, absorption exceeding deliveries, and record leasing volume all support holding rate and reducing concessions. Investment activity remained steady at $369M in Q1 with 6.2% cap rates. Institutional buyers are prioritizing stabilized assets with durable income. If you’re holding quality product in strong corridors, the fundamentals are moving your way.
Submarket Breakdown
South Dallas / I-20 / I-45 Corridor
DFW’s largest concentration of big-box distribution product. The I-20 and I-45 corridors provide connectivity to Houston, Austin, and the broader Texas Triangle. This is where many of the largest recent transactions have occurred. Vacancy has been elevated due to speculative deliveries but is compressing. Rents: $7.50–9.50/SF NNN for large-format product.
North Fort Worth / Alliance
Anchored by the Alliance development and BNSF intermodal facility, North Fort Worth is DFW’s premier rail-served logistics submarket. DSV Contract Logistics’ 1 million SF lease was in this corridor. Strong 3PL and e-commerce demand. Modern product commands $8.50–11.00/SF NNN. The Alliance corridor has seen some of the fastest vacancy improvement.
DFW Airport / Irving / Grand Prairie
Central DFW’s infill industrial market, serving both logistics and light manufacturing. Proximity to the airport and the Metroplex’s population center makes this attractive for last-mile and service distribution. Tighter than outer submarkets. Rents: $9.50–12.00/SF NNN. Limited new development constrains supply.
East Dallas / Kaufman County
DFW’s emerging industrial frontier, with available land and lower development costs attracting spec builders. Vacancy is higher here as newer product finds tenants, but I-20 access and competitive pricing are drawing logistics tenants from more expensive submarkets. Rents: $7.00–9.00/SF NNN.
| Submarket | Vacancy | Rent Range (NNN/SF) | Q1 2026 Profile |
|---|---|---|---|
| South Dallas / I-20 / I-45 | Compressing | $7.50–$9.50 | Big-box distribution, spec absorbing |
| North Fort Worth / Alliance | Improving | $8.50–$11.00 | Rail-served, 3PL hub, fastest recovery |
| DFW Airport / Irving | Tighter | $9.50–$12.00 | Infill, last-mile, limited new supply |
| East Dallas / Kaufman | Elevated | $7.00–$9.00 | Emerging, value play, spec leasing up |
Co-Warehousing & Flexible Warehouse Space in Dallas-Fort Worth
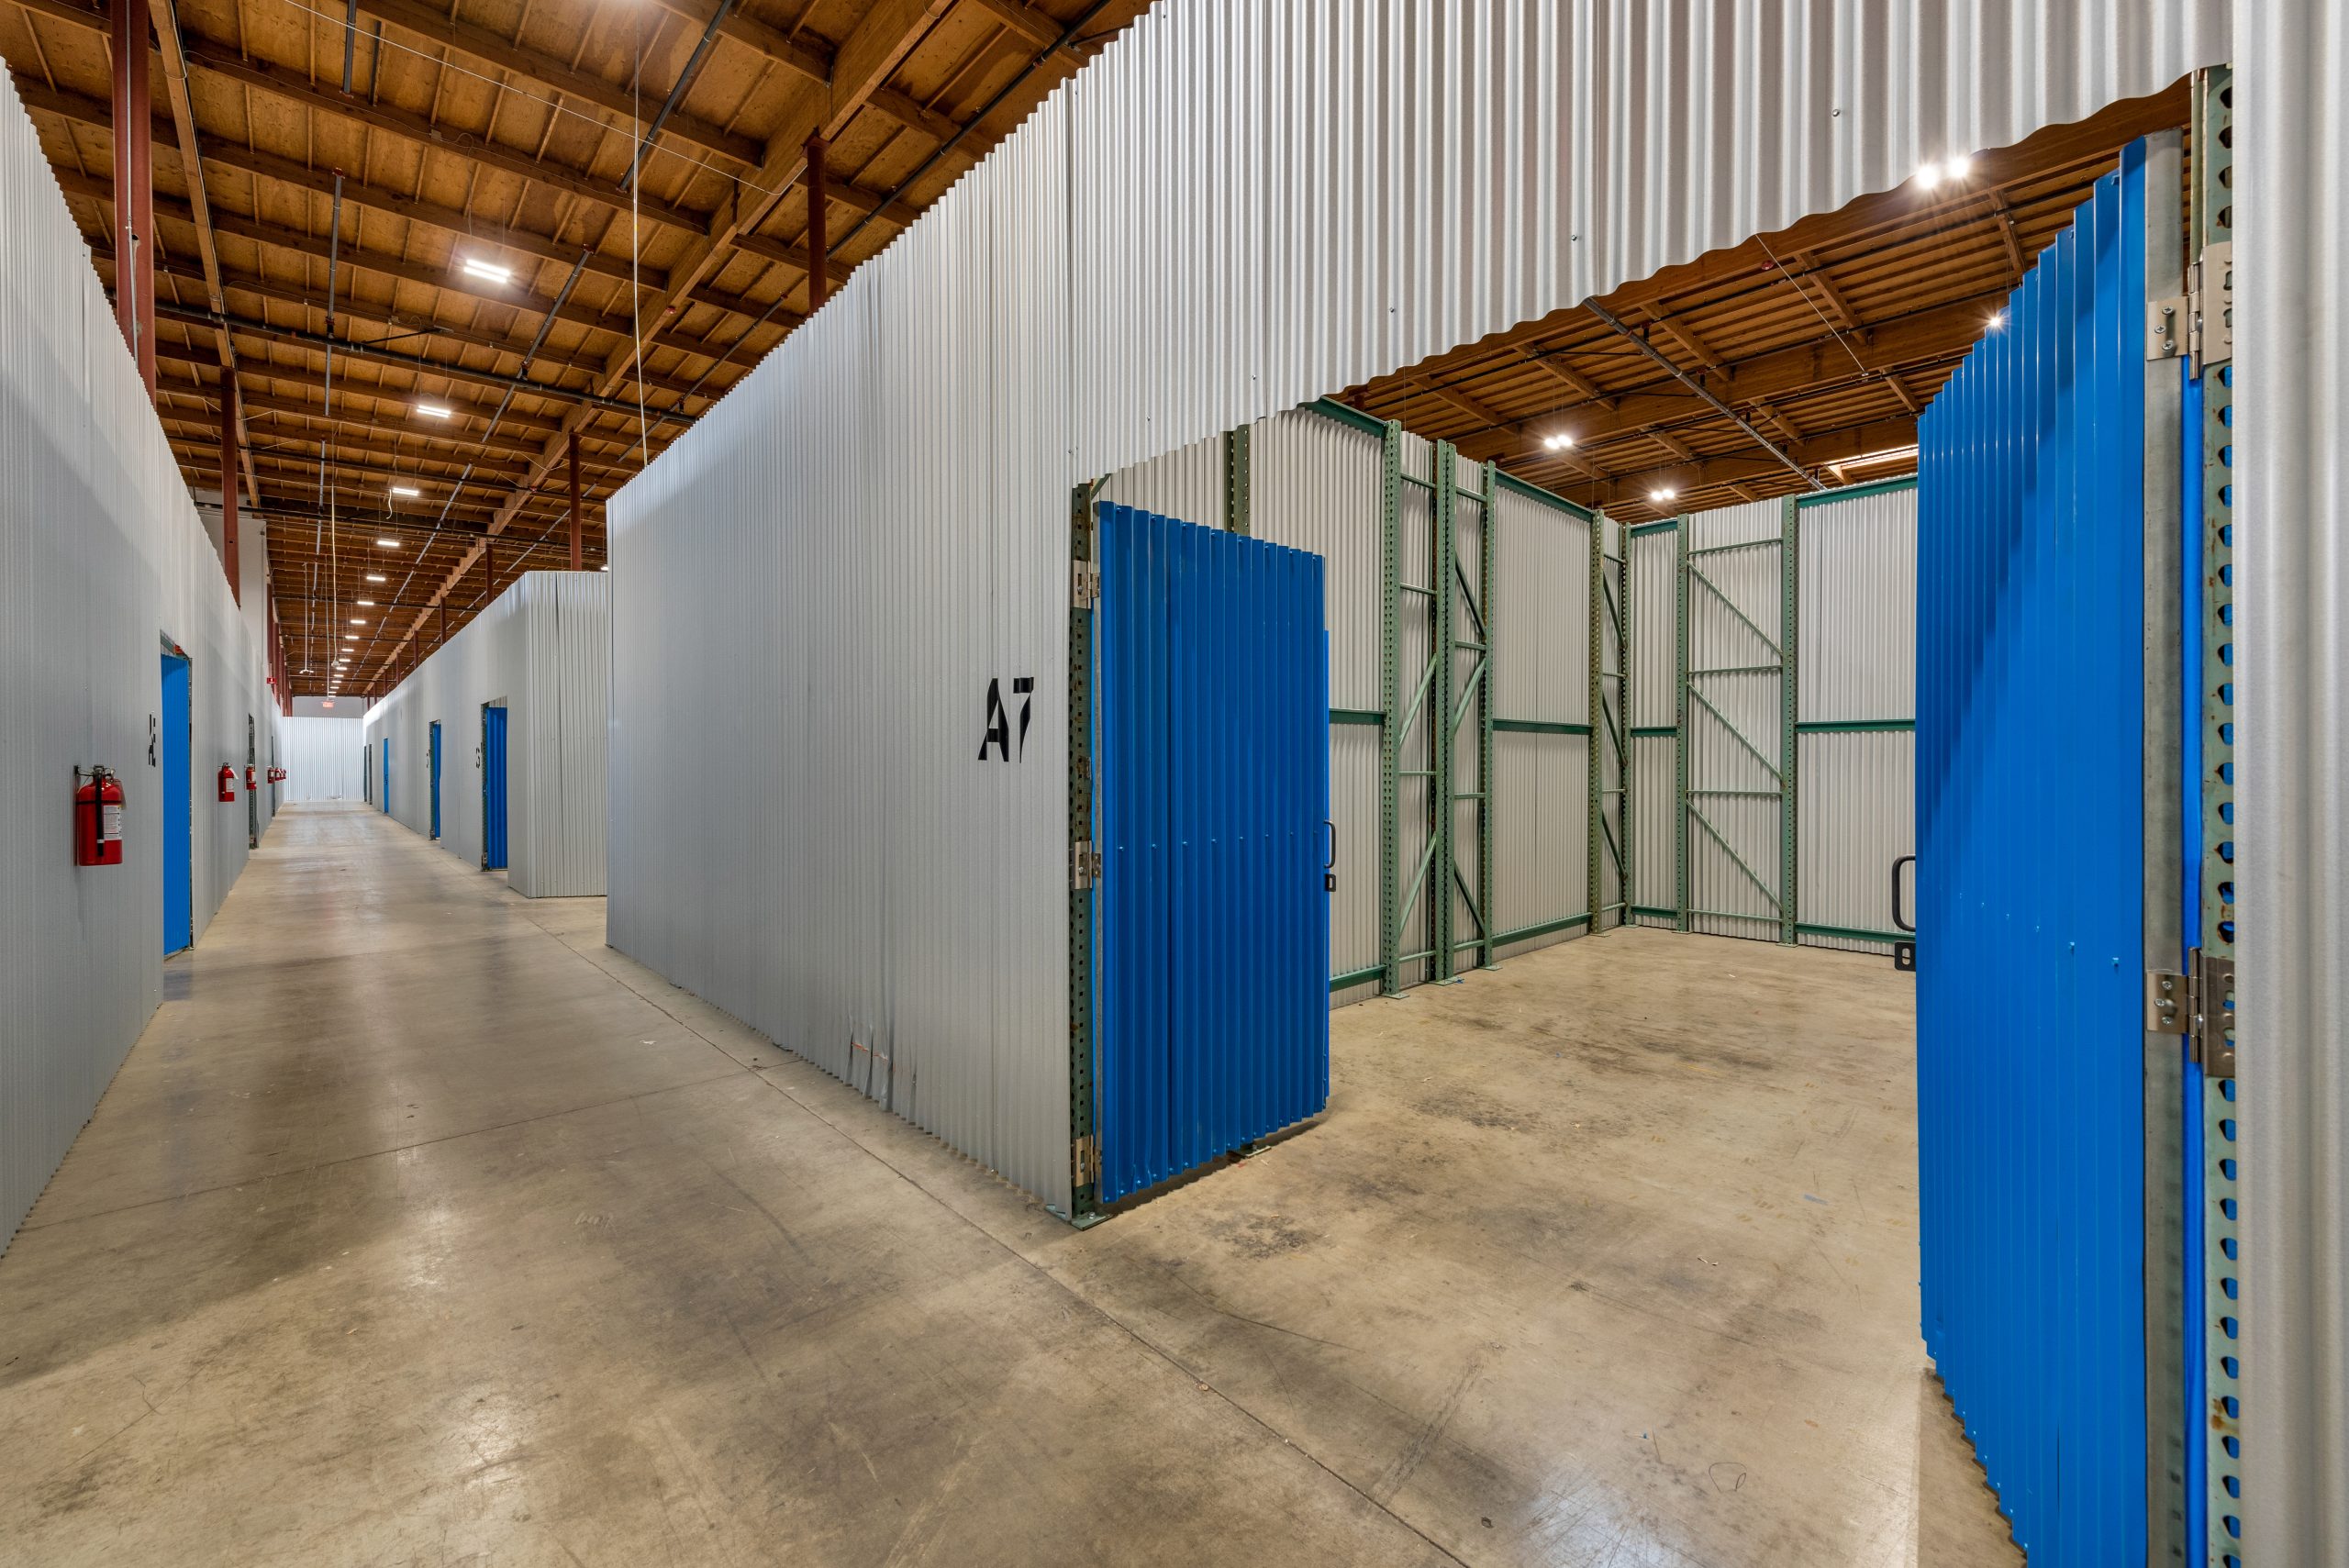
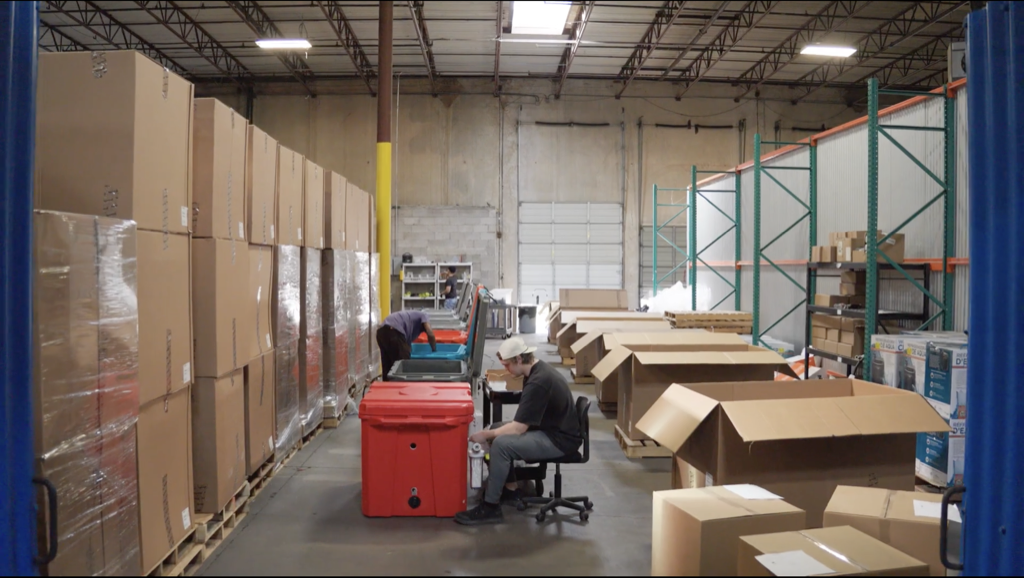
DFW’s flexible warehouse market benefits from the metro’s massive small business economy and its role as a national distribution hub. While bulk logistics drives the headline numbers, small-bay and flex demand serves the thousands of SMBs that need operational space without million-SF commitments.
Who’s leasing flexible space in DFW: E-commerce sellers leveraging DFW’s central US distribution reach, 3PL operators who need scalable overflow space, construction and building trades serving the metro’s aggressive development pipeline, food and beverage distributors covering the Texas market, and corporate relocations needing transitional warehouse access.
Browse available co-warehousing and small-bay warehouse listings on WareCRE’s Dallas marketplace.
Looking for warehouse space in Dallas-Fort Worth?
Key Trends to Watch
1. 3PL Dominance Is Reshaping the Tenant Mix
Third-party logistics firms accounted for four of the top five leases in Q1 2026, including DSV’s 1 million SF deal. This reflects a structural shift: as supply chains grow more complex and companies outsource logistics, 3PL operators are the largest consumer of industrial space nationally. DFW’s central geography makes it a natural 3PL hub. For broader context: Industrial Real Estate Trends & Outlook 2026.
2. The Oversupply Correction Is Working
DFW is the poster child for the national industrial market correction. After speculative construction pushed vacancy above 10%, the self-correcting mechanism (slower starts, sustained demand, pre-leasing discipline) is bringing the market back into balance. Vacancy has dropped 137 bps from peak. This trajectory validates the thesis that well-located, well-connected industrial markets work through oversupply cycles through demand strength, not just supply pullback. Read more: Small-Bay vs. Big-Box: What the Vacancy Gap Means in 2026.
3. Reshoring and Texas’ Gateway Positioning
As companies reconfigure supply chains around tariff uncertainty and nearshoring from Mexico, Texas is positioned as North America’s industrial gateway. DFW’s combination of intermodal rail access (BNSF and UP), I-20/I-35/I-45 highway connectivity, and a 4 million+ metro workforce creates a logistics proposition that’s hard to replicate. See: How Tariffs Are Reshaping Warehouse Demand in 2026.
Outlook: What to Watch in Q2–Q3 2026
DFW’s industrial market is on a clear recovery trajectory, and the question is no longer whether the market stabilizes but how quickly it tightens.
Expect vacancy to continue declining toward the 7.5–8.0% range by year-end 2026 as absorption outpaces deliveries. Pre-leasing rates on new construction validate demand strength.
Rents should hold and gradually increase, particularly for modern Class A product in the Alliance and DFW Airport corridors. Concessions will narrow as vacancy compresses. The 3.8% annual growth rate has room to accelerate.
The biggest opportunity is for tenants who lock in space now, before vacancy compression eliminates the concession environment. For investors, DFW’s improving fundamentals and $147/SF average pricing offer a compelling entry point relative to coastal markets.
Find warehouse space in Dallas-Fort Worth
Browse co-warehousing, small-bay, and distribution listings across the DFW Metroplex.
Data sources: Matthews Real Estate DFW Industrial Q1 2026, Savills DFW Industrial Q1 2026, Newmark Dallas Industrial Q1 2026, Cushman & Wakefield DFW MarketBeat Q1 2026, Avison Young DFW Industrial Market Report Q4 2025, CBRE U.S. Industrial Figures Q1 2026, WareCRE marketplace data (May 2026).
Related Resources
Frequently Asked Questions
What is the current industrial vacancy rate in Dallas-Fort Worth?
DFW industrial vacancy is 8.7–8.8% as of Q1 2026, down from a peak above 10%, the first time below 10% since Q4 2023. Vacancy has declined 137 basis points from peak, driven by record leasing volume and absorption outpacing new deliveries roughly 2:1.
How much does warehouse space cost in Dallas-Fort Worth?
Average asking rents are $10.24/SF NNN as of Q1 2026, with 3.8% annual growth. Rates range from $7.00–9.50/SF for large distribution space in the southern and eastern corridors to $9.50–12.00/SF for infill product near DFW Airport. The DFW average sits right at the national benchmark of $10.20/SF.
Why is DFW such a strong industrial market?
DFW sits at the intersection of I-20, I-35, and I-45 with BNSF and Union Pacific intermodal facilities, providing multimodal freight access to all of North America. The metro’s 4 million+ workforce, pro-business tax environment, and central US geography make it a natural hub for 3PL, e-commerce, and national distribution operations. 56 million SF of leasing in 2025 was 50% above long-term norms.
Which DFW submarket is best for warehouse space?
North Fort Worth/Alliance is the premier rail-served logistics corridor with BNSF intermodal access. South Dallas/I-20 offers the most big-box options at competitive pricing. DFW Airport/Irving provides infill proximity for last-mile distribution. East Dallas/Kaufman County has the best value pricing for cost-sensitive operations.