Indianapolis Industrial & Warehouse Market Report | Q2 2026
Key Takeaways
- Indianapolis industrial vacancy fell to 6.0% in Q2 2026, down from 7.0% in Q1 and 470 basis points lower than a year earlier. Vacancy peaked at 11.0% in Q3 2024.
- Net absorption reached 4.2 million SF in Q2 and 7.8 million SF in the first half, up 348.9% year over year. Over the last four quarters the market absorbed 19.6 million SF.
- The average asking rent rose $0.21 in the quarter to $6.31/SF/yr net, the largest quarterly gain since Q4 2023. That is still about 39% below the U.S. average of $10.32/SF/yr.
- Developers are building again. Space under construction jumped from 3.6 million SF to 6.5 million SF in one quarter, and speculative construction is up 579.8% over 12 months.
Browse warehouse space for rent in Indianapolis
6.0%
Overall Vacancy (Q2 2026)
$6.31
Avg. Asking Rent ($/SF/yr net)
4.2M
SF Net Absorption (Q2 2026)
6.5M
SF Under Construction
Indianapolis kept tightening in Q2 2026. Net absorption of 4.2 million SF pushed vacancy down a full percentage point to 6.0%, and asking rents posted their biggest quarterly gain in more than two years. With vacancy back near balance, developers have returned. The construction pipeline nearly doubled in the quarter, and more of it is speculative. For tenants, the East and South submarkets still have the most room to negotiate. The North, West and Northwest are tight.
Figures are from Cushman & Wakefield’s Q2 2026 Indianapolis Industrial MarketBeat unless noted. Prior-quarter and year-ago comparisons use the figures as restated in C&W’s Q2 2026 U.S. Industrial MarketBeat tables. Rents are weighted net asking rents, quoted in $/SF/yr.
Market Snapshot: Q2 2026
| Metric | Q2 2026 | Q1 2026 (restated) | YoY or note |
|---|---|---|---|
| Overall vacancy | 6.0% | 7.0% | ↓470 bps YoY (10.7% in Q2 2025) |
| Overall asking rent ($/SF/yr net) | $6.31 | $6.10 | +5.2% YoY (from $6.00) |
| Warehouse/distribution asking rent ($/SF/yr) | $6.15 | n/a | Manufacturing $5.55 |
| Net absorption | 4.2M SF | 3.6M SF | 7.8M SF year to date, up 348.9% YoY |
| New leasing activity | 5.1M SF | n/a | +42.6% YoY; 16 leases over 100,000 SF |
| Deliveries | 760,876 SF | 533,157 SF | 1.3M SF year to date |
| Under construction | 6.5M SF | 3.6M SF | 19 projects: 10 build-to-suit, 9 speculative |
| Inventory | 357.0M SF | n/a | Sublease availability 1.5M SF, down from 1.6M SF |
Source: Cushman & Wakefield, Indianapolis Industrial MarketBeat Q2 2026. Q1 2026 and Q2 2025 values as restated in C&W’s U.S. Industrial MarketBeat Q2 2026 metro tables; Q1 2026 deliveries are Q2 year-to-date completions less Q2 completions. n/a = not restated in the Q2 reports.
Rent Trends: Largest Quarterly Gain Since 2023, Up 5.2% on the Year
The average net asking rent rose $0.21 in Q2 2026 to $6.31/SF/yr. C&W calls it the largest quarterly gain since Q4 2023. Rents are up 5.2% from $6.00 a year earlier. The increase was broad, with seven of the market’s nine submarkets recording higher asking rents. The Northeast (+$0.42) and Northwest (+$0.19) posted the biggest gains.
Indianapolis rents remain well below the national average. Warehouse/distribution space asks $6.15/SF/yr, and Modern Bulk space, the largest product type, asks $5.54/SF/yr. The U.S. overall average in the same C&W release is $10.32/SF/yr. Within the metro, warehouse-heavy submarkets such as the South ($5.59) and East ($5.96) are the cheapest, while the Northeast ($9.64) and North ($10.87) are the most expensive.
For Tenants
Leverage depends on where you look. The East (10.0% vacancy) and South (8.8%) still carry the most vacant space and the lowest rents, even after vacancy there fell 790 bps and 820 bps over the year. The North, West and Northwest range from 2.0% to 3.6% vacancy, so expect to pay close to asking there. Large users face more competition, with leases over 400,000 SF up 150.0% year over year. Search Indianapolis warehouse listings on WareCRE.
Construction Pipeline: 6.5M SF Underway as Speculative Building Returns
Space under construction rose from 3.6 million SF to 6.5 million SF in Q2 2026. The market has 19 projects underway, 10 build-to-suit and 9 speculative. Speculative construction is up 579.8% over the past 12 months, and 83.7% of it is Modern Bulk product. The largest projects are HarperCollins’ 1.5 million SF build-to-suit facility in Brownsburg and a 1.2 million SF speculative building at I-65 Park South Logistics Center in Whiteland.
Deliveries remain light for now. Just over 760,000 SF completed in Q2 across five projects, bringing the first-half total to 1.3 million SF. Over the past 10 quarters the market delivered 12.5 million SF, compared with 59.6 million SF in the previous 10-quarter period. That slowdown gave demand time to absorb the 51.8 million SF delivered in 2022 and 2023.
For Operators
Fundamentals favor owners today, with vacancy at 6.0% and rents rising in seven of nine submarkets. The risk is the next supply wave. The West, South and Northwest account for more than 4.3 million SF, or 66.8%, of the pipeline. Modern Bulk vacancy is already 8.6%, compared with 4.4% for Medium Distribution. Owners of big-box space in those corridors should expect new competition once the speculative buildings deliver.
Submarket Breakdown
C&W tracks nine Indianapolis submarkets. The four below hold the most inventory and drove most of the quarter’s leasing and absorption. The Southwest (1.6 million SF) and South (677,000 SF) led Q2 net absorption, and half of the quarter’s 16 leases over 100,000 SF were signed in those two submarkets.
Southwest (Plainfield and Airport)
The metro’s largest submarket at 104.3 million SF and its big-box core, anchored by the FedEx hub at Indianapolis International Airport. Vacancy is 5.2% and the average asking rent is $6.04/SF/yr. It absorbed 3.3 million SF in the first half, the most of any submarket, and has 634,357 SF under construction.
Northwest (I-65: Lebanon and Whitestown)
A 79.3 million SF corridor along I-65 northwest of the city. Vacancy is 3.6%, among the tightest in the metro, and rents average $7.60/SF/yr after a $0.19 gain in Q2. It has 1.2 million SF under construction, and Caterpillar’s build-to-suit expansion in Lebanon was one of the quarter’s completions.
East (I-70: Mt. Comfort)
The newer big-box corridor along I-70, 64.9 million SF. At 10.0% it still has the highest vacancy in the metro, even after a 790 bps drop over the year. Rents average $5.96/SF/yr. FedEx Supply Chain’s 532,062 SF lease at 9347 Pendleton Pike was one of the quarter’s largest deals.
South (I-65: Greenwood and Whiteland)
A 35.7 million SF submarket with the lowest average rent in the metro, $5.59/SF/yr. Vacancy fell 820 bps over the year to 8.8%. Legacy Supply Chain Solutions (808,505 SF) and Amazon (584,820 SF) both signed new leases here in Q2. The South has 1.2 million SF under construction, including the speculative I-65 Park South building.
| Submarket | Vacancy | Asking Rent ($/SF/yr net) | YTD Net Absorption (SF) | Under Construction (SF) |
|---|---|---|---|---|
| Southwest | 5.2% | $6.04 | 3,346,714 | 634,357 |
| Northwest | 3.6% | $7.60 | 1,060,930 | 1,157,896 |
| East | 10.0% | $5.96 | 871,587 | 157,796 |
| South | 8.8% | $5.59 | 1,609,555 | 1,195,623 |
| West | 3.3% | $7.43 | -393,975 | 1,966,232 |
| Northeast | 4.3% | $9.64 | 569,336 | 894,100 |
| Indianapolis total | 6.0% | $6.31 | 7,763,732 | 6,471,372 |
Source: Cushman & Wakefield, Indianapolis Industrial MarketBeat Q2 2026, market statistics table. The Downtown, North and Southeast submarkets are included in the total but not shown.
Co-Warehousing & Flexible Warehouse Space in Indianapolis
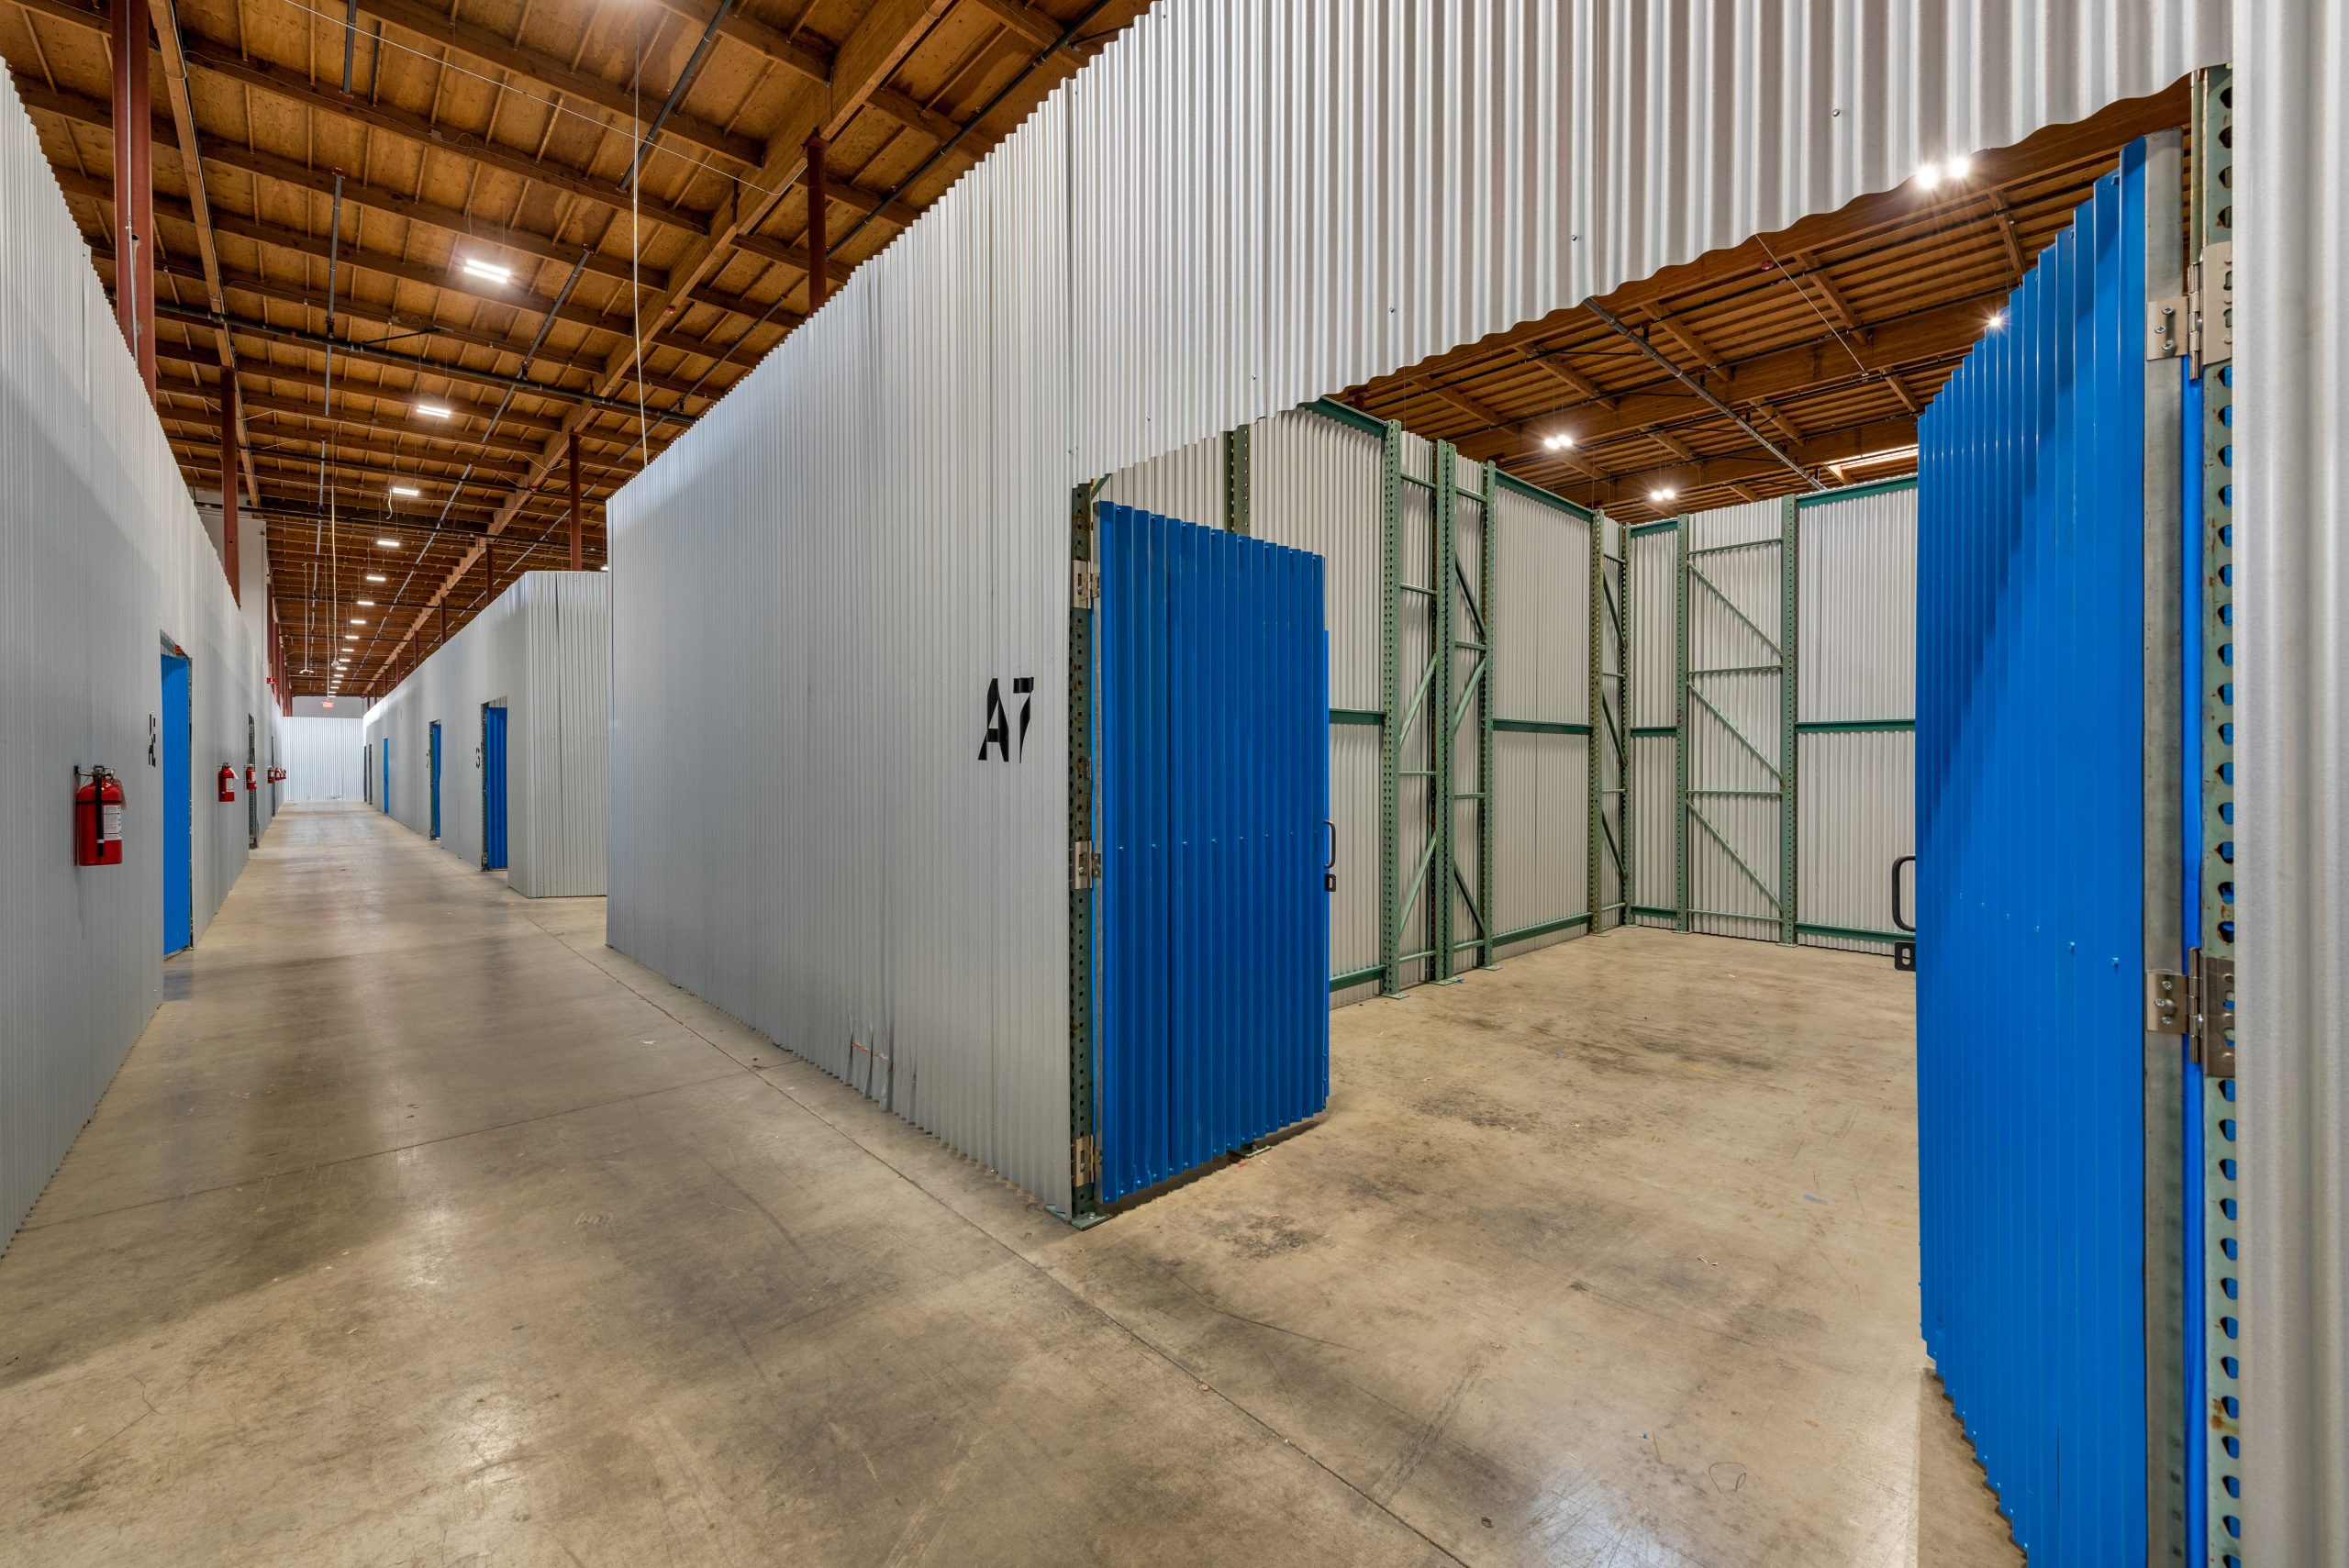
Big-box distribution drives Indianapolis’ headline numbers, but small-bay product is tighter. C&W reports Flex space at 4.3% vacancy across 8.5 million SF, asking $9.84/SF/yr, and Office Showroom space at 3.7% vacancy, asking $10.42/SF/yr. Flex and Office Showroom rents led product-type rent growth in Q2, up $0.24 and $0.21.
The FedEx hub draws e-commerce and parcel operators to flexible space in Indianapolis, and 3PLs use it for access to the metro’s interstates. Contractors, manufacturers and suppliers, and regional distributors serving the central US make up most of the remaining demand.
Browse available co-warehousing and small-bay warehouse listings on WareCRE’s Indianapolis marketplace.
Looking for warehouse space in Indianapolis?
Key Trends to Watch
1. Demand Has Absorbed the 2022–2023 Construction Wave
The market absorbed 19.6 million SF over the last four quarters, up 389.2% from the prior four-quarter period. That demand, combined with a sharp drop in deliveries, took vacancy from its 11.0% peak in Q3 2024 to 6.0%. Modern Bulk’s share of total vacant space fell from 77.0% to 68.6% over the year. For broader context: Industrial Real Estate Trends & Outlook 2026.
2. Speculative Construction Is Back, and It Is Mostly Big-Box
Speculative construction is up 579.8% over 12 months, and 83.7% of speculative space underway is Modern Bulk. C&W says developers are likely to keep pursuing speculative projects if vacancy stays in check. Eight of the nine submarkets have projects underway, but the West, South and Northwest hold two-thirds of the pipeline.
3. Big-Box Tenants Are Driving Leasing
Warehouse/distribution leasing accounted for 97.6% of Q2 activity, and leases over 400,000 SF rose 150.0% year over year. The four key Q2 leases C&W lists ranged from 532,062 SF to Prime Beverage Group’s 915,600 SF. Smaller spaces are tighter. Medium Distribution vacancy is 4.4%, about half the Modern Bulk rate. Read more: Small-Bay vs. Big-Box: What the Vacancy Gap Means in 2026.
Outlook: What to Watch in Q4 2026
C&W’s Q3 2026 MarketBeats are due in mid-October, with the year-end release to follow. Those two reports will show whether Indianapolis can keep tightening while the new pipeline moves toward delivery.
Watch whether absorption holds its pace. The market has averaged close to 5 million SF a quarter over the last year, and a Q3 figure well below that would suggest demand is cooling just as supply picks up.
Watch the pace of deliveries, especially in the West, South and Northwest, which hold two-thirds of the pipeline. Only 1.3 million SF completed in the first half, against 6.5 million SF under construction.
Watch whether rents keep climbing after Q2’s $0.21 gain, the largest since Q4 2023. Another gain of that size would confirm that owners have regained pricing power. A flat quarter would point to the East and South, where vacancy is still highest, holding the average down.
Find warehouse space in Indianapolis
Browse co-warehousing, small-bay, and distribution listings across the Indianapolis metro.
Data sources: Cushman & Wakefield Indianapolis Industrial MarketBeat Q2 2026 (headline, submarket and product-type figures; rents weighted net asking, $/SF/yr); Cushman & Wakefield U.S. Industrial MarketBeat Q2 2026 (restated Q1 2026 and Q2 2025 figures and U.S. averages). Each report reflects the most recent vacancy, rental, and construction data available at the time of publication. We refresh our reports as new market data is released, and we’re continually expanding coverage to additional metros.
Related Resources
Frequently Asked Questions
What is the current industrial vacancy rate in Indianapolis?
Indianapolis industrial vacancy was 6.0% in Q2 2026, according to Cushman & Wakefield, down from 7.0% in Q1 and 470 basis points lower than a year earlier. It varies by submarket, from 2.0% in the North to 10.0% in the East.
How much does warehouse space cost in Indianapolis?
The overall average asking rent was $6.31/SF/yr net in Q2 2026, up 5.2% year over year. Warehouse/distribution space averaged $6.15/SF/yr and Modern Bulk $5.54/SF/yr. By submarket, rents run from $5.59/SF/yr in the South to $10.87/SF/yr in the North. The U.S. average in the same release was $10.32/SF/yr.
Which Indianapolis submarket is best for warehouse space?
It depends on the requirement. The Southwest, near the airport and Plainfield, is the largest big-box submarket at 5.2% vacancy. The East (10.0%) and South (8.8%) have the most availability and the lowest rents. The Northwest along I-65 is tight at 3.6% and asks $7.60/SF/yr.
How much industrial space is under construction in Indianapolis?
6.5 million SF was under construction at the end of Q2 2026, up from 3.6 million SF in Q1, across 19 projects, 10 build-to-suit and 9 speculative. Speculative construction is up 579.8% over 12 months. First-half deliveries totaled 1.3 million SF.
What are the Indianapolis industrial market trends in 2026?
Demand is strong and supply is returning. The market absorbed 7.8 million SF in the first half of 2026 and 19.6 million SF over the last four quarters, taking vacancy from an 11.0% peak in Q3 2024 to 6.0%. Rents posted their largest quarterly gain since Q4 2023, and developers have nearly doubled the construction pipeline.