San Francisco Bay Area Warehouse Market Report 2026
Last Updated: February 2026 If you’re looking for warehouse space in the San Francisco Bay Area, you’re entering one of the most expensive and supply-constrained industrial markets in the country – and one that’s telling two very different stories right now. The logistics and warehouse segment remains fundamentally tight, while the flex/R&D market is drowning in life sciences space that nobody seems to want. Understanding which side of that divide you’re on will determine your experience in this market. Let me walk you through the real dynamics playing out, from the East Bay’s workhorse distribution corridors to the Peninsula’s sky-high premiums. Whether you’re a small business looking for flexible warehouse space or a broker navigating the Bay Area’s uniquely constrained geography, here’s what you need to know.Why the Bay Area Warehouse Market Defies National Trends
Key Takeaways
- The Bay Area industrial market is deeply bifurcated – logistics warehouse vacancy sits around 7-9%, while flex/R&D vacancy has surged past 23%
- Industrial rents average $16-28/SF annually – among the highest in the nation – but rent growth has stalled or turned slightly negative
- Geographic constraints (water, mountains, zoning) severely limit new warehouse development, creating chronic supply scarcity
- AI industry boom and population rebound are creating renewed demand for last-mile logistics space across the metro
Market Snapshot: Bay Area Warehouse Facts
~8%
Logistics Warehouse Vacancy
$28/SF
Avg Asking Rent (Industrial)
7.7M
Metro Population
| Metric | Value |
|---|---|
| Average Asking Rent (Industrial) | $28.00/sq ft (highest in U.S.) |
| Logistics/Warehouse Vacancy | ~7-9% |
| Flex/R&D Vacancy | ~23% |
| Overall Industrial Vacancy | ~13% (blended, misleading) |
| Small-Bay Vacancy (<50K SF) | ~5% |
| Metro Population | 7.7 million |
| Port of Oakland TEUs (2025) | 2.5 million+ |
The Submarkets That Matter Most
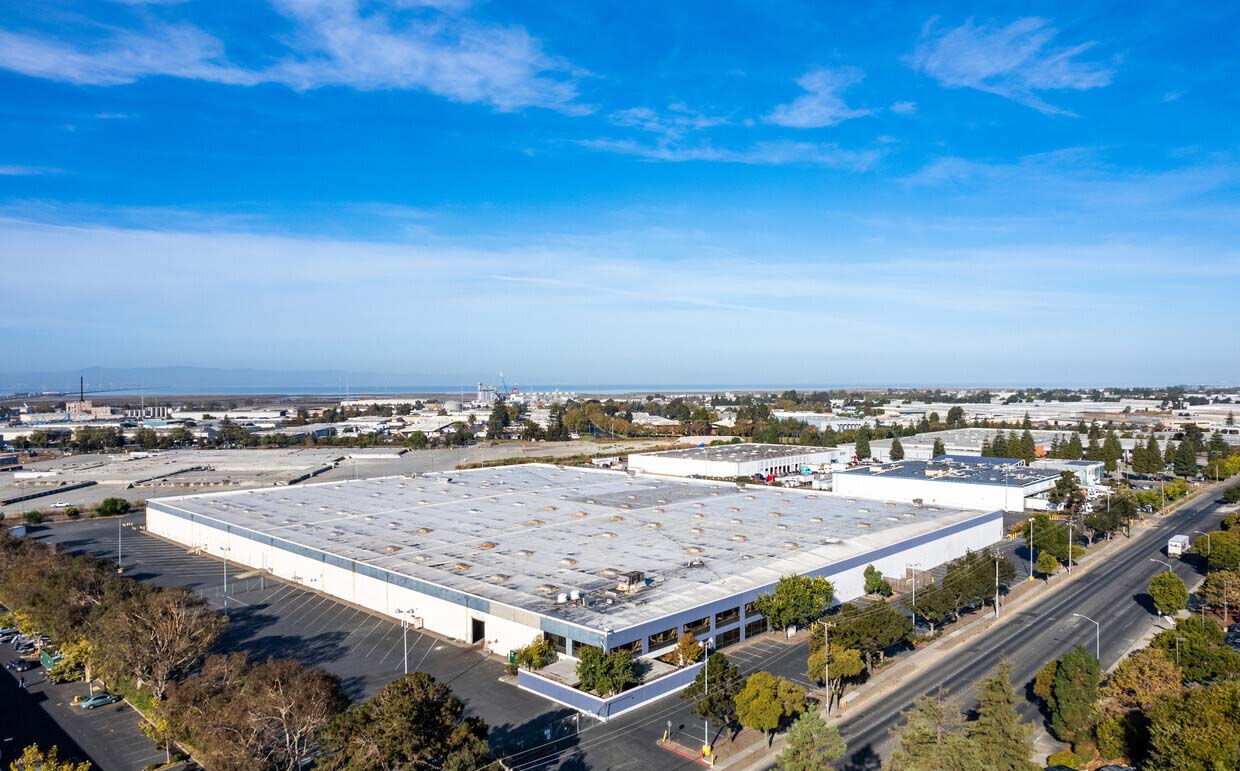
East Bay (Oakland, Hayward, Fremont, Union City)
The Bay Area’s primary distribution corridor, anchored by Port of Oakland access and I-880/I-580 connectivity.- Average rates: $14-20/sq ft NNN for warehouse
- Most diverse industrial submarket – distribution, manufacturing, food processing
- Port of Oakland provides direct Pacific Rim trade access
- I-880 corridor from Oakland to Fremont is the logistics spine
- Newer product in Hayward and Union City commands premiums
- Labor pool is more accessible and affordable than Peninsula locations
South San Francisco / Peninsula
Historically dominated by life sciences and biotech R&D, now awash in vacant flex space but with scarce logistics inventory.- Average rates: $24-36/sq ft (flex/R&D); $20-28/sq ft (warehouse)
- Flex vacancy has surged past 20% due to biotech funding downturn
- Pure warehouse space remains exceptionally tight – under 5% vacancy
- Proximity to SFO Airport for air cargo operations
- Competition from alternative land uses (housing, office) limits industrial expansion
- Life sciences pipeline may recover by 2027, absorbing excess flex
San Jose / South Bay
Silicon Valley’s industrial base, serving both tech manufacturing and regional distribution.- Average rates: $16-24/sq ft NNN
- Larger facility footprints available compared to SF proper
- Strong demand from tech hardware, data center support, and AI infrastructure
- Highway 101 and I-880 access
- Some flex-to-warehouse conversion opportunities emerging
- Growing last-mile delivery presence for the South Bay consumer base
North Bay (Richmond, San Rafael, Novato)
Emerging industrial corridor with more competitive pricing and access to the north.- Average rates: $12-18/sq ft NNN
- More affordable alternative to East Bay and Peninsula
- Richmond offers port-adjacent industrial with rail access
- I-80 and Highway 101 connectivity
- Growing interest from businesses priced out of core Bay Area
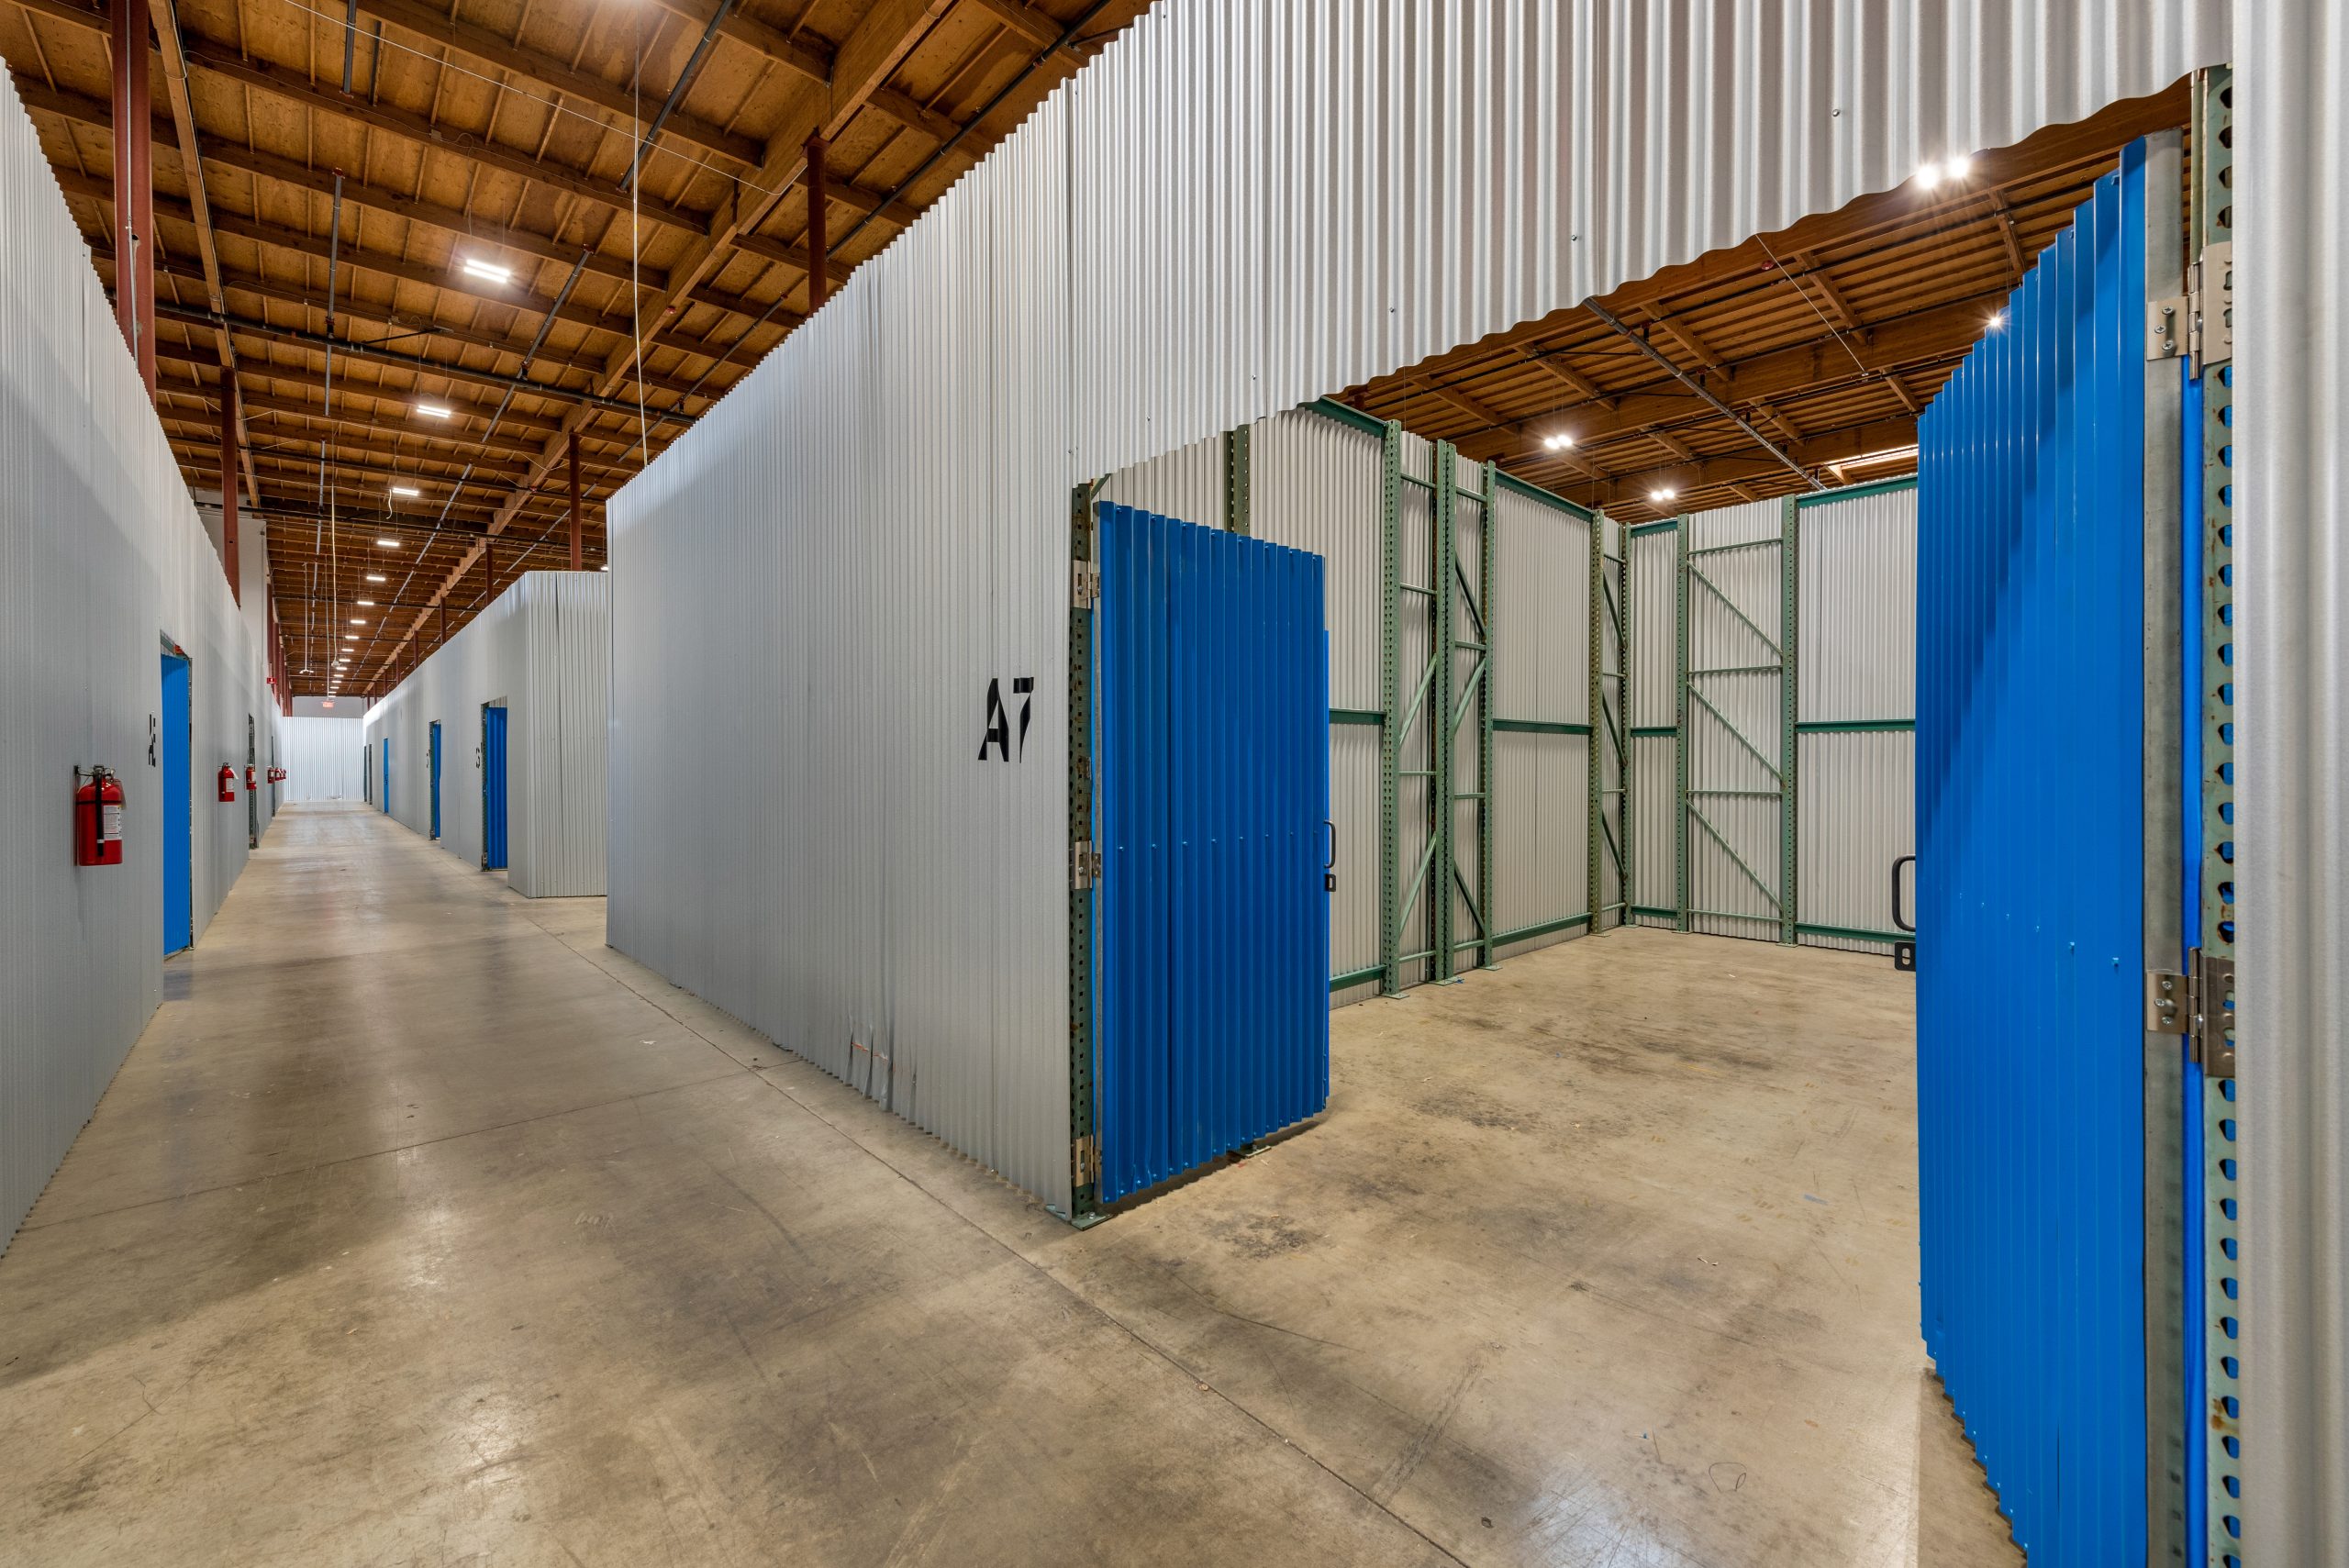
- Smaller facilities dominate – well-suited for small business needs
What Small Businesses Need to Know
The Bay Area’s warehouse market is defined by scarcity. Geographic constraints – the Bay itself, mountains, protected open space, and strict zoning – mean that the industrial land base isn’t growing. What exists is increasingly valuable, and competition from alternative land uses (housing, mixed-use, data centers) continuously threatens to shrink it further. Your advantages in this market:- Affluent consumer base – 7.7 million consumers with the highest median household income of any major metro
- AI boom spillover – Massive tech hiring is driving population rebound and warehouse demand
- Port of Oakland – Third-largest West Coast port, direct Pacific Rim access
- Flex space opportunity – Life sciences downturn creating warehouse-suitable space at lower rates
- No significant new supply – Geographic constraints prevent the oversupply plaguing other markets
- Tech ecosystem – Proximity to the world’s largest tech companies creates unique logistics needs
- Year-round climate – Mild weather supports efficient warehouse operations
- Highest rents in the country – Industrial rents roughly double the national average
- Extreme land scarcity – Very limited new construction possible
- Regulatory burden – CEQA, local permitting, and environmental requirements add cost and time
- Labor costs – Minimum wage is $18.67+ statewide; many Bay Area cities set higher floors
- Traffic congestion – I-880 and Bay Bridge bottlenecks impact logistics efficiency
- Property taxes – California’s Prop 13 benefits long-time owners but new lessees face market rates
- Tariff sensitivity – West Coast port volumes have been volatile due to trade policy
Looking for flexible warehouse space in the Bay Area?
View Available Units
Bay Area vs. Competing California Markets
| Factor | SF Bay Area | Inland Empire | Central Valley |
|---|---|---|---|
| Average Rent | $16-28/sq ft | $10-14/sq ft | $6-10/sq ft |
| Logistics Vacancy | ~8% | 7.7% | 8.5% |
| New Supply Risk | Very Low (constrained) | High (active pipeline) | Moderate |
| Consumer Proximity | 7.7M (Bay Area) | 18M+ (SoCal access) | Limited local |
| Port Access | Oakland (direct) | LA/LB (60 mi) | Oakland (90+ mi) |
Rate Ranges by Submarket
| Submarket | Rate Range ($/sq ft NNN) |
|---|---|
| South San Francisco (warehouse) | $20.00-28.00 |
| Oakland/Alameda | $14.00-20.00 |
| Hayward/Union City | $14.00-18.00 |
| Fremont/Milpitas | $16.00-22.00 |
| San Jose | $16.00-24.00 |
| Richmond/North Bay | $12.00-18.00 |
| Flex/R&D Space (Peninsula) | $24.00-36.00 |
| Sublease Opportunities | 15-30% below direct rates |
Operating Cost Considerations
- Property taxes: ~1.1% of assessed value (Prop 13 base)
- Triple net expenses: $3.00-5.50/sq ft annually
- Utilities: PG&E rates among the highest in the nation
- Labor: Warehouse wages $20-28/hr, well above national average
- State regulations: Cal/OSHA, CEQA, and AB 5 compliance add cost
Looking Ahead: What’s Coming in 2026
The Good
- AI-driven demand – Tech companies expanding logistics and hardware operations
- Population rebound – San Francisco adding residents again after pandemic outflows
- Constrained supply – No significant new warehouse construction in the pipeline
- Flex conversion opportunity – Some R&D space being repurposed for logistics
- Port stability – Oakland port operations normalizing after tariff disruptions
- Rent correction – Asking rents have moderated, creating entry points for cost-conscious tenants
The Challenges
- Highest costs nationally – Rents, labor, and operating costs are all premium tier
- Tariff uncertainty – West Coast ports experienced significant disruption in 2025
- Life sciences overhang – 23%+ flex vacancy weighing on blended market metrics
- Regulatory environment – California remains the most regulated state for business operations
- Housing costs – Employee housing affordability directly impacts labor availability
- Infrastructure aging – Much of the East Bay industrial stock needs modernization
Making Your Move: Practical Next Steps
If you’re a small business owner:
- Focus on the East Bay – Best value for warehouse operations with port and highway access
- Explore flex-to-warehouse conversions – Life sciences downturn has opened up suitable space
- Consider co-warehousing – Shared facilities offset the Bay Area’s premium pricing
- Lock in favorable terms – Rent growth has stalled; negotiate longer terms at current rates
- Factor total cost of operations – Labor, utilities, and regulatory compliance are significant
- Verify PG&E capacity – Power availability varies significantly by building and location
- Plan for traffic patterns – I-880 and bridge congestion can add 30-60 minutes to delivery routes
If you’re a broker:
- Separate the flex narrative from warehouse – Blended vacancy numbers mislead; segment your analysis
- Highlight supply scarcity – No new warehouse supply coming; this isn’t Phoenix or Dallas
- Present the AI demand thesis – Tech expansion is creating real new logistics requirements
- Offer creative solutions – Flex-to-warehouse conversions, co-warehousing, and split-use arrangements
- Quantify the NorCal premium – Proximity to 7.7M affluent consumers has measurable value
- Track sublease opportunities – Life sciences companies releasing well-located space