Houston Industrial & Warehouse Market Report | Q1 2026
Key Takeaways
- Houston industrial vacancy edged up to 7.5% in Q1 2026, up about 80 basis points year-over-year, as a heavy wave of speculative big-box construction outpaced even strong demand. Vacancy is likely to drift higher through 2026 as more unleased space delivers.
- Demand itself is healthy: Houston posted +3.7 million SF of net absorption in Q1 2026, extending a 16-year streak of positive annual absorption. The softness is a supply story, not a demand story.
- Asking rents averaged about $0.87/SF NNN per month (roughly $10.44/SF annually), up 10.1% year-over-year but down 2.2% from the prior quarter, a sign that rent growth is moderating as new supply competes.
- The market is splitting by size: big-box spec gives large tenants real leverage, while limited new small-bay construction keeps that segment tight. Browse Houston warehouse listings on WareCRE.
7.5%
Overall Vacancy
$0.87
Avg. Asking Rent (NNN/SF/Mo)
+3.7M
SF Net Absorption (Q1)
29M
SF Under Construction
Houston is one of the largest and fastest-growing industrial markets in the country, anchored by Port Houston (the busiest U.S. Gulf Coast container port), a vast petrochemical complex, and a metro population that keeps expanding. Entering Q1 2026, Houston’s story is the inverse of many coastal markets: demand is strong, but supply is even stronger. Net absorption stayed solidly positive, yet a large speculative construction pipeline pushed vacancy up to 7.5%. The result is a market that is fundamentally healthy but, for now, tilting toward tenants in the big-box segment.
For businesses looking for warehouse space in Houston, that supply wave is good news if you need large, modern distribution space. Availability and concessions are the best they’ve been in years. Smaller users face a tighter picture, because new small-bay construction has been limited. Here’s the full Q1 2026 breakdown.
Market Snapshot: Q1 2026
| Metric | Q1 2026 | Context |
|---|---|---|
| Overall vacancy | 7.5% | ↑80 bps YoY; spec supply driving the rise |
| Avg. asking rent | ~$0.87/SF NNN/mo | ~$10.44/SF/yr; +10.1% YoY, −2.2% QoQ |
| Q1 net absorption | +3.7M SF | 16-year streak of positive absorption |
| Deliveries (Q1) | 4.5M SF | Large-format, much of it unleased |
| Under construction | ~29M SF | Only ~25% pre-leased; speculative-heavy |
| Vacancy by type | Flex 11.8% / Mfg 2.5% | Manufacturing tightest; flex loosest |
Rent Trends: Up Year-Over-Year, Cooling Quarter-to-Quarter
Houston asking rents averaged roughly $0.87/SF NNN per month in Q1 2026, about $10.44/SF on an annual basis. That’s up 10.1% year-over-year, reflecting the market’s long demand run, but down 2.2% from the prior quarter, the first clear sign that the speculative supply wave is starting to weigh on pricing. Rents vary by product type: flex space averages around $0.98/SF/mo, manufacturing about $0.91, and warehouse/distribution about $0.83.
With roughly 29 million SF under construction and only about a quarter of it pre-leased, large-format landlords are competing harder for tenants. Expect face rents to flatten and concessions to widen on big-box space through 2026, while small-bay product, where almost no new supply is being added, holds firmer.
For Tenants
If you need big-box distribution space, Houston is working in your favor: a deep pipeline of unleased spec product means real negotiating room on rate, free rent, and TI. If you need small-bay or flex space, move with more urgency. Limited new construction keeps that segment tight and competitive. Search Houston warehouse listings on WareCRE.
Construction Pipeline: A Speculative Supply Wave
Houston’s construction pipeline stands at about 29 million SF, with roughly 4.5 million SF delivered in Q1 2026 alone. Critically, only around 25% of what’s under construction is pre-leased. The bulk is speculative, large-format logistics product concentrated in suburban and port-adjacent submarkets. That unleased space is the main reason vacancy is expected to climb further through the year, and it has stretched lease-up timelines on the largest buildings.
This is a developer response to Houston’s long demand run, and the market keeps absorbing space (3.7 million SF in Q1, a 16-year positive streak). But supply is simply arriving faster than even healthy demand can fill it. Small-bay construction, by contrast, remains scarce, which is why that segment is moving in the opposite direction.
For Operators
Demand fundamentals remain among the best in the nation, a 16-year absorption streak and continued population and port growth. Near term, though, the spec wave argues for protecting occupancy over pushing rate on large-format assets. Small-bay and manufacturing product (2.5% vacancy) is where pricing power is strongest, and lease-up risk lowest.
Submarket Breakdown
North / I-45 North & Hwy 290
Houston’s largest big-box distribution corridor, with deep modern inventory and much of the metro’s speculative pipeline. Strong connectivity north toward Dallas and the broader Texas Triangle. This is where availability and tenant leverage are highest. Warehouse rents: ~$0.70–$0.95/SF NNN/mo.
Southeast / Port Houston & Bayport
The port-driven submarket serving Port Houston, the Bayport and Barbours Cut container terminals, and the petrochemical complex. Demand here is tied to import volumes, plastics/resin exports, and energy. Functional, well-located product stays in demand. Warehouse rents: ~$0.80–$1.05/SF NNN/mo.
Northwest
An established infill and light-industrial submarket serving local distribution and manufacturing. More balanced supply-demand than the big-box corridors, with steadier small-bay and flex demand. Warehouse rents: ~$0.80–$1.05/SF NNN/mo.
Southwest / Sugar Land
Serves the fast-growing southwestern suburbs and Fort Bend County. A mix of distribution and last-mile product oriented to the residential growth corridor. Tighter small-bay conditions. Warehouse rents: ~$0.85–$1.10/SF NNN/mo.
| Submarket | Profile | Rent Range (NNN/SF/Mo) | Q1 2026 Notes |
|---|---|---|---|
| North / I-45 & Hwy 290 | Big-box hub | $0.70–$0.95 | Most spec supply, best tenant leverage |
| Southeast / Port & Bayport | Port / petrochemical | $0.80–$1.05 | Import- and energy-driven demand |
| Northwest | Infill / light-industrial | $0.80–$1.05 | Steadier small-bay/flex demand |
| Southwest / Sugar Land | Suburban / last-mile | $0.85–$1.10 | Residential-growth corridor, tighter small-bay |
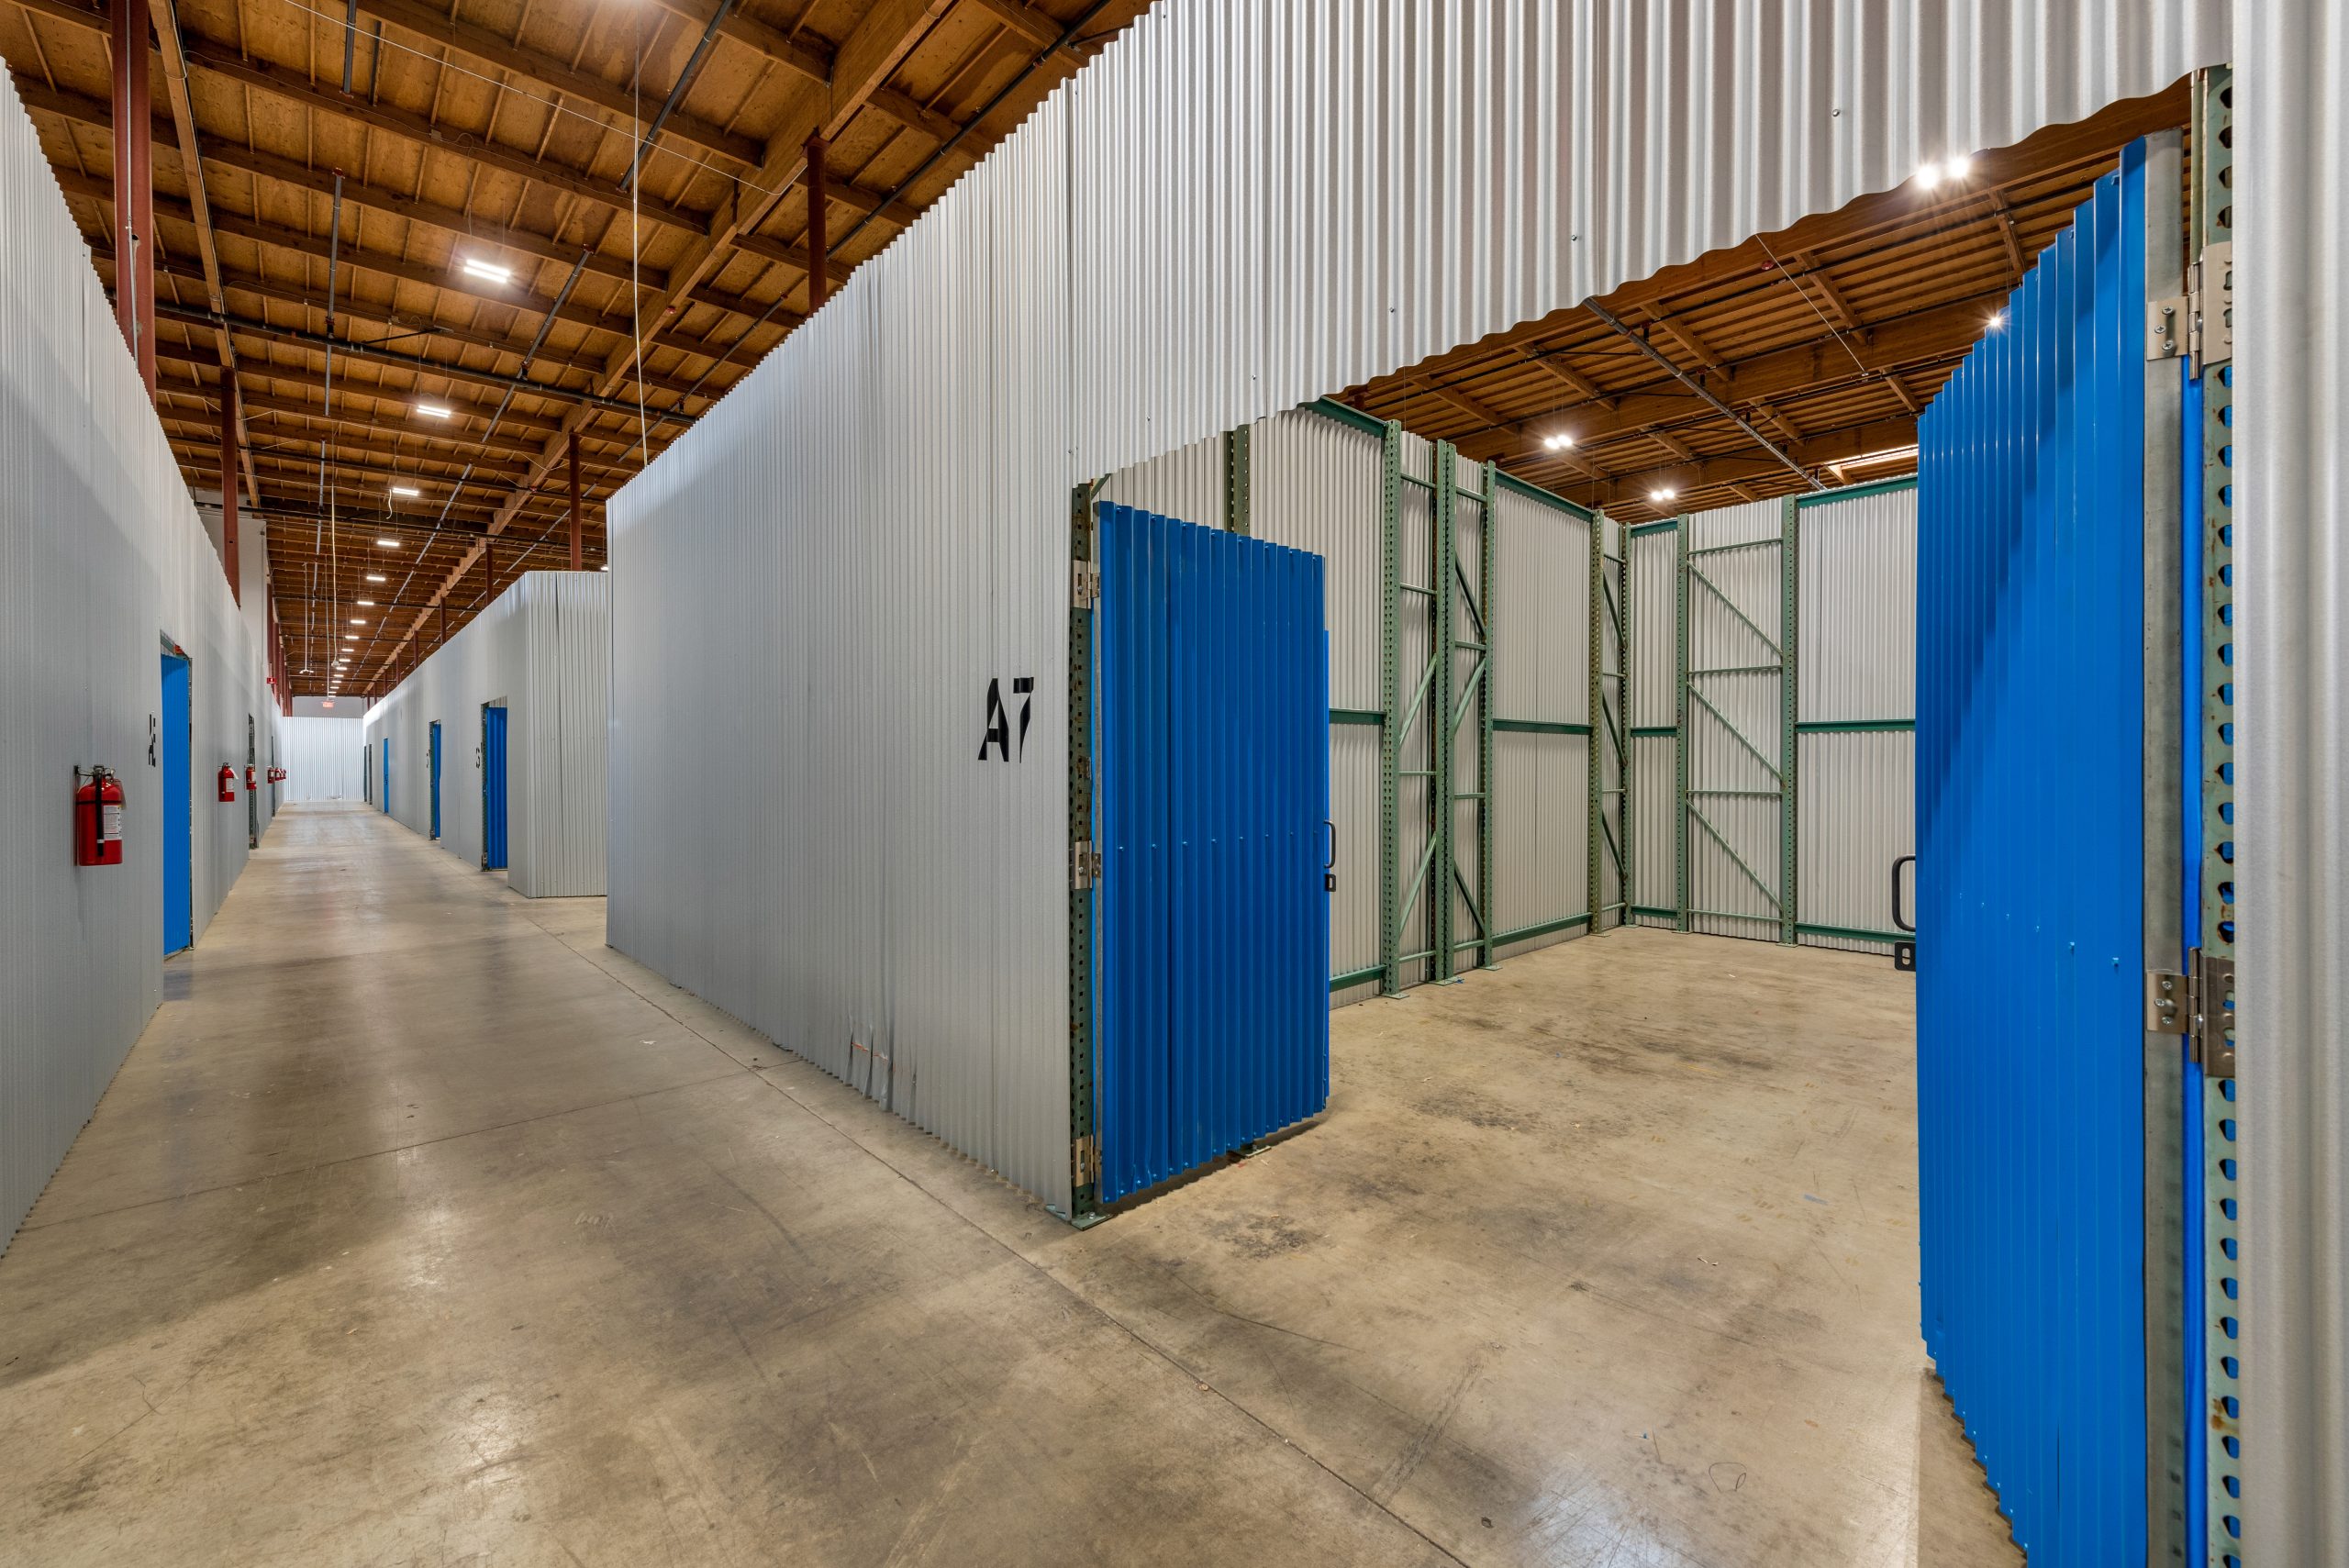
Co-Warehousing & Flexible Warehouse Space in Houston
Houston’s flexible warehouse market is supported by an enormous small business economy, a booming population, and the metro’s role as a Gulf Coast trade and energy hub. While the speculative big-box wave drives the headline numbers, small-bay and flex demand serves the thousands of contractors, distributors, and service businesses that need operational space without committing to hundreds of thousands of square feet, and that segment stays tight because so little new small-bay product is being built.
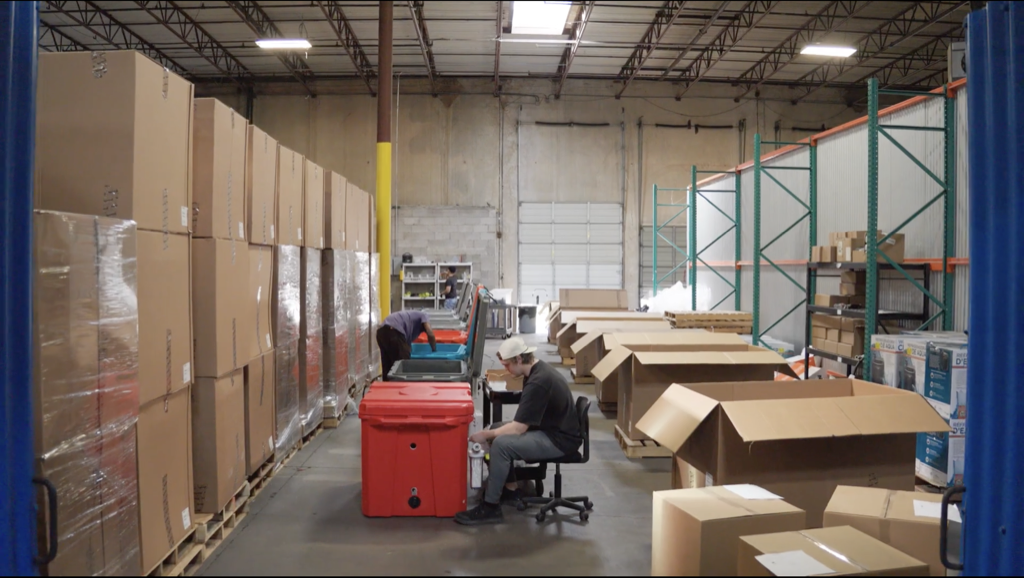
Who’s leasing flexible space in Houston: e-commerce and last-mile operators serving a growing metro, energy-services and oilfield suppliers, construction and building trades, importers and distributors moving goods through Port Houston, and food and beverage businesses covering the region.
Browse available co-warehousing and small-bay warehouse listings on WareCRE’s Houston marketplace.
Looking for warehouse space in Houston?
Key Trends to Watch
1. Big-Box Spec vs. Small-Bay Scarcity
Houston is a textbook case of size segmentation. A 29 million SF pipeline, only ~25% pre-leased, is pushing big-box vacancy and tenant leverage up, while limited new small-bay construction keeps that segment tight (manufacturing vacancy is just 2.5%). The leverage you have depends heavily on the size of space you need. Read more: Small-Bay vs. Big-Box: What the Vacancy Gap Means in 2026.
2. Port Houston, Energy, and Petrochemicals
Houston’s demand base is unusually diversified for an industrial market: containerized imports through Port Houston, plastics and resin exports, energy-services supply chains, and a deep manufacturing base. That mix has powered a 16-year positive absorption streak and gives the market more demand durability than pure-logistics peers. For broader context: Industrial Real Estate Trends & Outlook 2026.
3. Population Growth and Gulf Gateway Positioning
Houston remains one of the nation’s fastest-growing metros, and its Gulf location positions it as a gateway for nearshoring and trade flows reshaped by tariff policy. Sustained consumption and trade growth are why developers keep building, and why demand keeps absorbing the space. See: How Tariffs Are Reshaping Warehouse Demand in 2026.
Outlook: What to Watch in Q2–Q3 2026
Houston’s industrial market is healthy underneath a supply-driven soft patch, and the near-term direction is set by how quickly the spec pipeline leases up.
Expect vacancy to rise modestly further as unleased large-format space delivers through 2026. This is a supply phenomenon (demand remains strongly positive), and vacancy should peak and stabilize as starts slow.
Rents should flatten on big-box product, with concessions widening, while small-bay and manufacturing space holds or gains. The 10% year-over-year growth rate will likely cool toward low single digits.
The biggest opportunity is for large tenants who can capitalize on the spec wave now, locking in favorable terms before absorption tightens the big-box segment again. Small-bay users should not wait for leverage that isn’t coming in that segment.
Find warehouse space in Houston
Browse co-warehousing, small-bay, and distribution listings across the Houston metro.
Data sources: Matthews Real Estate Houston Industrial Q1 2026, Partners Real Estate Houston Industrial Q1 2026, Colliers Houston Industrial Q1 2026, Cushman & Wakefield Houston MarketBeat Q1 2026, CBRE U.S. Industrial & Logistics Figures Q1 2026, JLL Houston Industrial Market Dynamics Q1 2026, WareCRE marketplace data (May 2026).
Related Resources
Frequently Asked Questions
What is the current industrial vacancy rate in Houston?
Houston industrial vacancy was 7.5% in Q1 2026, up about 80 basis points year-over-year. The increase is driven by a large speculative construction pipeline rather than weak demand. Net absorption stayed positive at 3.7 million SF in the quarter.
How much does warehouse space cost in Houston?
Average asking rents are about $0.87/SF NNN per month (roughly $10.44/SF annually) as of Q1 2026, up 10.1% year-over-year but down 2.2% from the prior quarter. Warehouse/distribution space averages around $0.83/SF/mo, with flex near $0.98 and manufacturing near $0.91.
Is Houston a good market for warehouse tenants right now?
For big-box and large distribution space, yes. A 29 million SF pipeline that’s only ~25% pre-leased gives large tenants strong leverage on rate and concessions. For small-bay and flex space, conditions are tighter because very little new small-format product is being built.
Which Houston submarket is best for warehouse space?
The North/I-45 & Hwy 290 corridor has the most big-box options and tenant leverage. Southeast/Port Houston & Bayport serves port and petrochemical users. Northwest offers steadier infill and light-industrial space, and Southwest/Sugar Land serves the growing southwestern suburbs and last-mile demand.