San Francisco Bay Area Industrial & Warehouse Market Report | Q2 2026
Key Takeaways
- East Bay industrial vacancy eased to 7.8% in Q2 2026, down 20 basis points from Q1. Net absorption turned positive at 65,895 SF after Q1’s largest single-quarter occupancy decline in over 10 years.
- Silicon Valley vacancy held at 6.4%, up 60 basis points year over year, while net absorption reached about 650,000 SF, the highest since Q4 2021.
- East Bay asking rents fell to $1.21/SF/mo NNN, down $0.07 year over year, while Silicon Valley averaged $1.63/SF/mo NNN, up 2.5%.
- Pipelines are limited, with 617,353 SF under construction in the East Bay and about 1.6 million SF in Silicon Valley, where Supermicro leased the newly completed 714,491 SF Bridge Point San Jose.
Browse warehouse space for rent in the San Francisco Bay Area
7.8% | 6.4%
Overall Vacancy, Q2 2026 (East Bay | Silicon Valley)
$1.21 | $1.63
Avg. Asking Rent, $/SF/mo NNN (East Bay | Silicon Valley)
66K | 650K
SF Net Absorption, Q2 2026 (East Bay | Silicon Valley)
617K | 1.6M
SF Under Construction (East Bay | Silicon Valley)
The Bay Area’s two main industrial markets both improved in Q2 2026. In the East Bay, occupancy stabilized after a sharp first-quarter loss, and gross leasing topped 3.0 million SF for just the third time in four years. In Silicon Valley, net absorption jumped to its highest level since 2021 on large manufacturing and warehouse move-ins. They differ on pricing, with East Bay rents still falling and Silicon Valley rents up on the year.
Figures are from Cushman & Wakefield’s Q2 2026 East Bay Oakland and Silicon Valley Industrial MarketBeats unless noted. San Francisco Peninsula and North Bay figures come from C&W’s Q2 2026 U.S. Industrial MarketBeat metro tables. Prior-quarter comparisons use the figures as restated in the Q2 reports. Rents are triple net (NNN) asking rates, quoted in $/SF per month by Bay Area convention. C&W counts Fremont and Newark in both its East Bay and Silicon Valley reports, so the two markets’ totals should not be added together.
Market Snapshot: Q2 2026
| Metric | Q2 2026 | Q1 2026 (restated) | YoY or note |
|---|---|---|---|
| East Bay vacancy | 7.8% | 8.0% | +10 bps YoY |
| Silicon Valley vacancy | 6.4% | 6.4% | +60 bps YoY; warehouse 6.5%, manufacturing 6.3% |
| East Bay asking rent ($/SF/mo NNN) | $1.21 | $1.24 | −$0.07 YoY |
| Silicon Valley asking rent ($/SF/mo NNN) | $1.63 | $1.64 | +2.5% YoY; warehouse $1.52, manufacturing $1.71 |
| East Bay net absorption | 65,895 SF | -1,134,126 SF | -1,068,231 SF year to date |
| Silicon Valley net absorption | 649,641 SF | 202,225 SF | 851,866 SF year to date |
| East Bay gross leasing | 3.1M SF | n/a | +16.0% YoY |
| Silicon Valley gross absorption (leasing and user sales) | 3.6M SF | n/a | +45.3% QoQ; +38.7% YoY |
| East Bay under construction | 617,353 SF | n/a | No completions year to date |
| Silicon Valley under construction | 1,577,362 SF | n/a | 786,041 SF completed year to date |
| San Francisco Peninsula vacancy | 4.8% | 4.7% | Flat YoY; C&W national table |
| San Francisco North Bay vacancy | 8.4% | 7.6% | +130 bps YoY; C&W national table |
Source: Cushman & Wakefield, East Bay Oakland and Silicon Valley Industrial MarketBeats Q2 2026; Peninsula and North Bay from C&W’s U.S. Industrial MarketBeat Q2 2026 metro tables. East Bay Q1 absorption is derived from the Q2 year-to-date and quarterly figures. C&W notes that its Silicon Valley market indicators are not reflective of the U.S. MarketBeat tables. n/a = not restated in the Q2 reports.
Rent Trends: East Bay Rents Slip to $1.21 While Silicon Valley Holds at $1.63
East Bay asking rents averaged $1.21/SF/mo NNN in Q2 2026, down $0.03 from Q1 and $0.07 from a year earlier. C&W attributes the decline to few new deliveries, which usually lift the average, weaker demand in parts of the market and falling prices for older buildings with low clear heights. Pricing is splitting by quality. New construction in Fremont is asking well over $1.85, while older space in Oakland is asking closer to $1.00. C&W also reports a growing gap between asking and transacting rates as some landlords close deals below advertised rents.
Silicon Valley’s average asking rent across all industrial sectors was $1.63/SF/mo NNN, down $0.01 in the quarter but up $0.04 (2.5%) year over year. Warehouse space averaged $1.52 and manufacturing $1.71. Submarket averages range from $1.34 in Morgan Hill/Gilroy to $3.45 in Mountain View.
For Tenants
The East Bay offers the most leverage. The number of vacant spaces of 25,000–50,000 SF is up 25.0% year over year, and Hayward (10.2% vacancy) and San Leandro (8.8%) have the most room to negotiate. Ask about effective rents as well as asking rates. Large blocks are harder to find, with vacancies over 100,000 SF down 21.2%. In Silicon Valley, Morgan Hill/Gilroy has the highest vacancy rate at 11.9%, and South San Jose (9.4%) has the most vacant space, about 2.2 million SF. Search Bay Area warehouse listings on WareCRE.
Construction Pipeline: Limited in Both Markets, With Fremont and San Jose Most Active
The East Bay had just 617,000 SF under construction or renovation at the end of Q2 2026, and nothing has delivered this year. C&W expects the limited pipeline to help avoid temporary spikes in vacancy, though targeted groundbreakings may pick up later in the year as quality space tightens in some submarkets.
Silicon Valley had 12 buildings totaling about 1.6 million SF under construction, eight of them speculative. Bridge Point San Jose, a four-building, 715,000 SF manufacturing park at 2350 Qume Drive, completed in Q2 and was fully leased by Supermicro. At the Campus at Bayside in Fremont, three speculative warehouse buildings totaling 211,000 SF broke ground without pre-leasing. C&W projects 617,000 SF to deliver in Q3, of which 364,000 SF is speculative space still unleased.
For Operators
In the East Bay, owners of modern space along the southern 880 Corridor are in the strongest position, with Fremont and Newark vacancy below 5.0%. Owners of older, low-clear space in Oakland, Hayward and San Leandro face the most pricing pressure. In Silicon Valley, 364,000 SF of unleased speculative space due in Q3 will compete for the same tenants, so lease-up assumptions for new projects should stay conservative.
Submarket Breakdown: Fremont and Newark Lead the East Bay
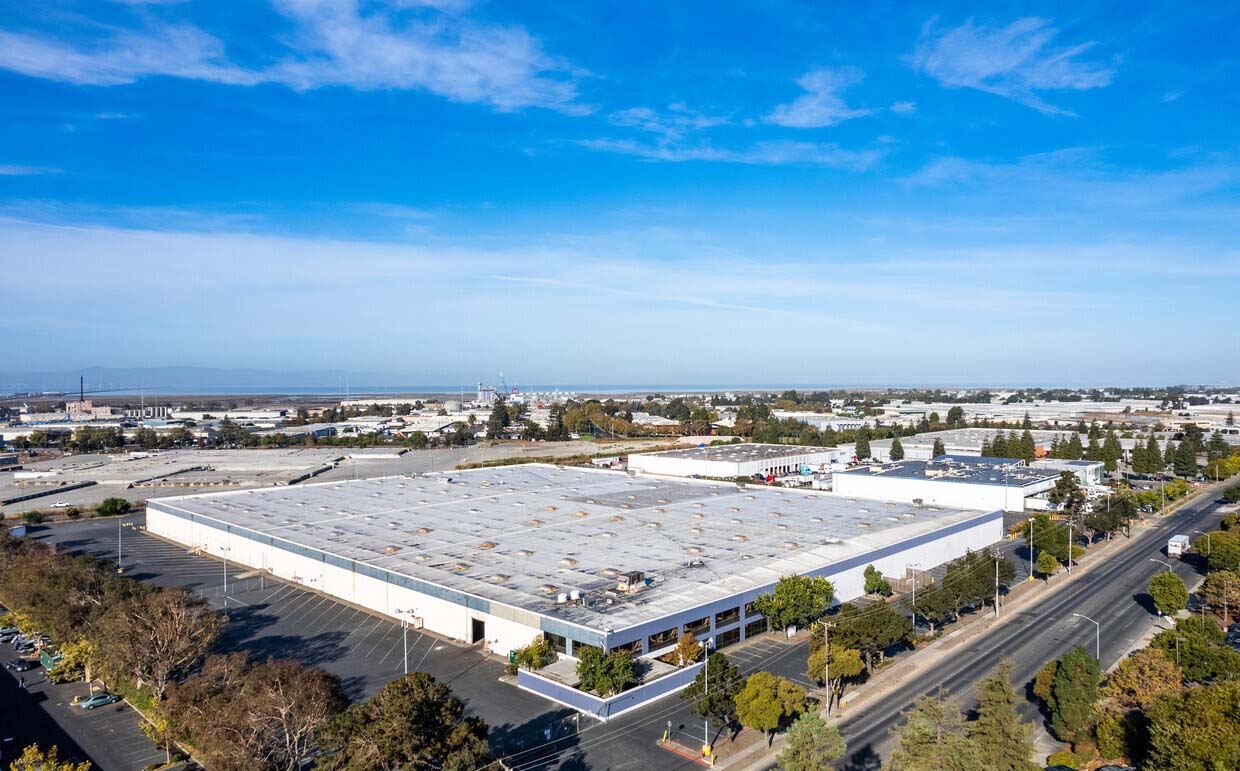
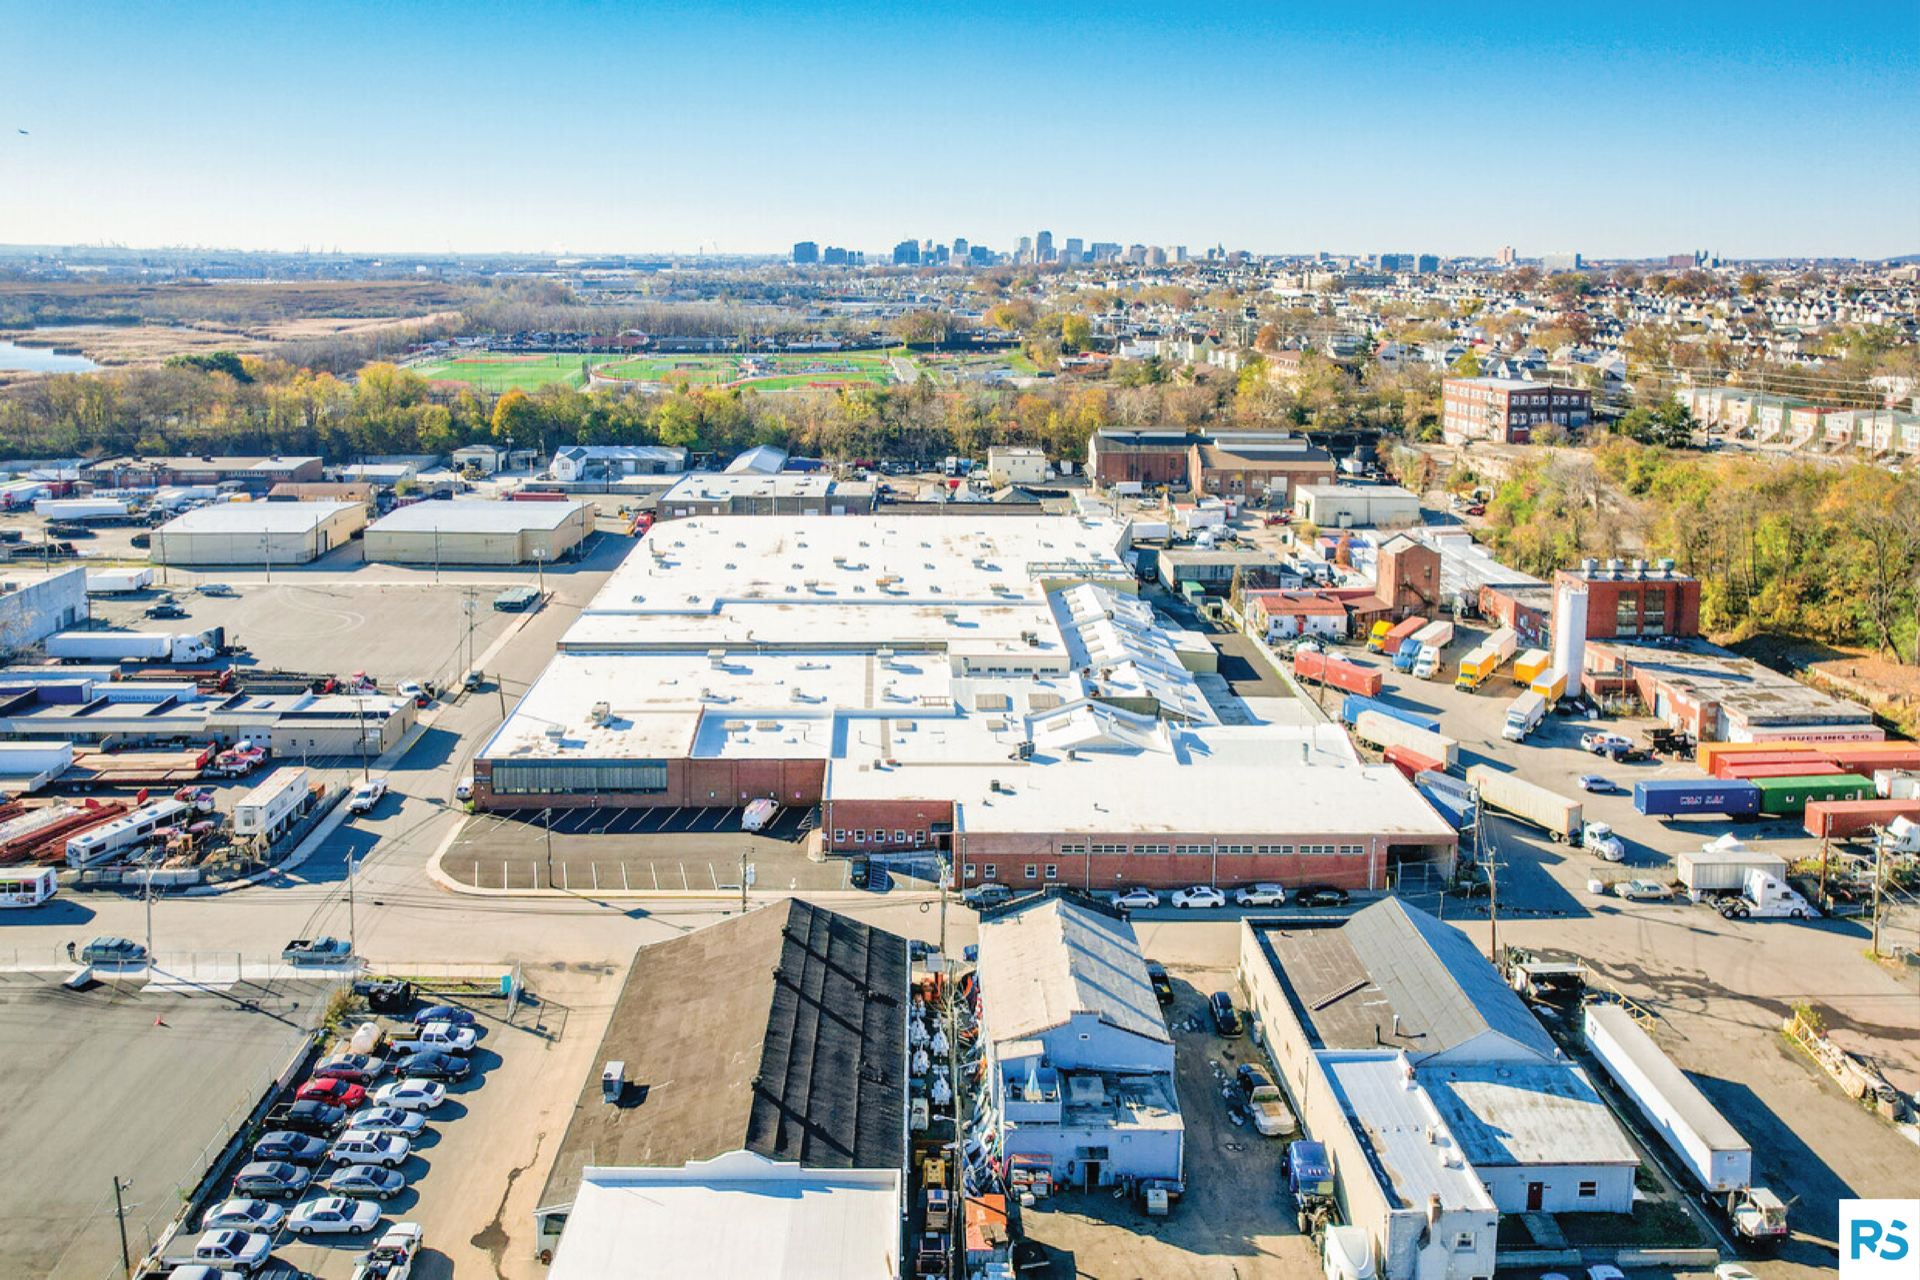
C&W reports the Bay Area as separate markets. The four sections below cover the East Bay’s traditional core, the southern 880 Corridor, San Jose and Silicon Valley, and the Peninsula and North Bay.
Oakland, Hayward and San Leandro
The East Bay’s traditional industrial core serves the Port of Oakland and a base of long-established industrial users. Vacancy is 8.1% in Oakland, 10.2% in Hayward and 8.8% in San Leandro, and C&W reports that more traditional users in Hayward and San Leandro are struggling to grow. Demand is shifting, though. Zoox leased 353,653 SF at PGIM’s Nexus Innovation Center in Hayward, the largest new lease of the quarter, and MiTAC leased 236,945 SF in Hayward. C&W expects the Hayward surge to bring vacancy down in coming quarters.
Fremont, Newark and the South 880 Corridor
The strongest part of the East Bay. Fremont absorbed 323,541 SF in Q2 and Newark 186,140 SF, and vacancy in both is below 5.0%, at 4.1% in Fremont and 3.6% in Newark. C&W attributes the demand to technology and advanced manufacturing firms that value proximity to Silicon Valley. Quanta leased 143,086 SF in Newark, its seventh new lease over 100,000 SF in a year.
San Jose and Silicon Valley
C&W’s Silicon Valley market covers 120.5 million SF from Palo Alto to Morgan Hill/Gilroy. Vacancy is 6.4% and the average asking rent is $1.63/SF/mo NNN. San Jose is split. North San Jose, with 20.7 million SF, has 7.6% vacancy and 642,223 SF under construction. South San Jose, the larger of the two at 23.9 million SF, has 9.4% vacancy. The two largest Q2 leases C&W highlights were in San Jose, Supermicro’s 714,491 SF at 2350 Qume Dr. in North San Jose and Nvidia’s 302,775 SF at 5853 Rue Ferrari in South San Jose. Santa Clara is among the tightest submarkets at 3.5%.
San Francisco Peninsula and North Bay
These smaller markets have no construction underway, according to C&W’s national tables. The Peninsula, with 39.9 million SF, has 4.8% vacancy and the highest average asking rent of the Bay Area markets in C&W’s national table, about $1.70/SF/mo (C&W publishes $20.38/SF/yr). The North Bay, with 32.9 million SF, is softer at 8.4% vacancy after negative absorption of 263,066 SF in Q2, with asking rent of about $1.19/SF/mo (C&W publishes $14.25/SF/yr).
| Submarket | Vacancy | Asking Rent ($/SF/mo NNN) | YTD Net Absorption (SF) | Under Construction (SF) |
|---|---|---|---|---|
| Oakland (East Bay) | 8.1% | $1.18 | -330,166 | 176,889 |
| Hayward (East Bay) | 10.2% | $1.13 | -708,131 | 97,620 |
| San Leandro (East Bay) | 8.8% | $1.07 | -145,771 | 0 |
| East Bay Oakland total | 7.8% | $1.21 | -1,068,231 | 617,353 |
| South I-880 Corridor (Fremont, Newark, Milpitas) | 3.8% | $1.51 | 656,825 | 828,139 |
| North San Jose | 7.6% | $1.50 | 146,070 | 642,223 |
| South San Jose | 9.4% | $1.79 | -115,011 | 0 |
| Santa Clara | 3.5% | $1.82 | 95,862 | 107,000 |
| Silicon Valley total | 6.4% | $1.63 | 851,866 | 1,577,362 |
Source: Cushman & Wakefield, East Bay Oakland Industrial MarketBeat Q2 2026 (Oakland, Hayward, San Leandro and East Bay total) and Silicon Valley Industrial MarketBeat Q2 2026 (all other rows), market statistics tables. Fremont and Newark are included in both totals.
Co-Warehousing & Flexible Warehouse Space in the Bay Area
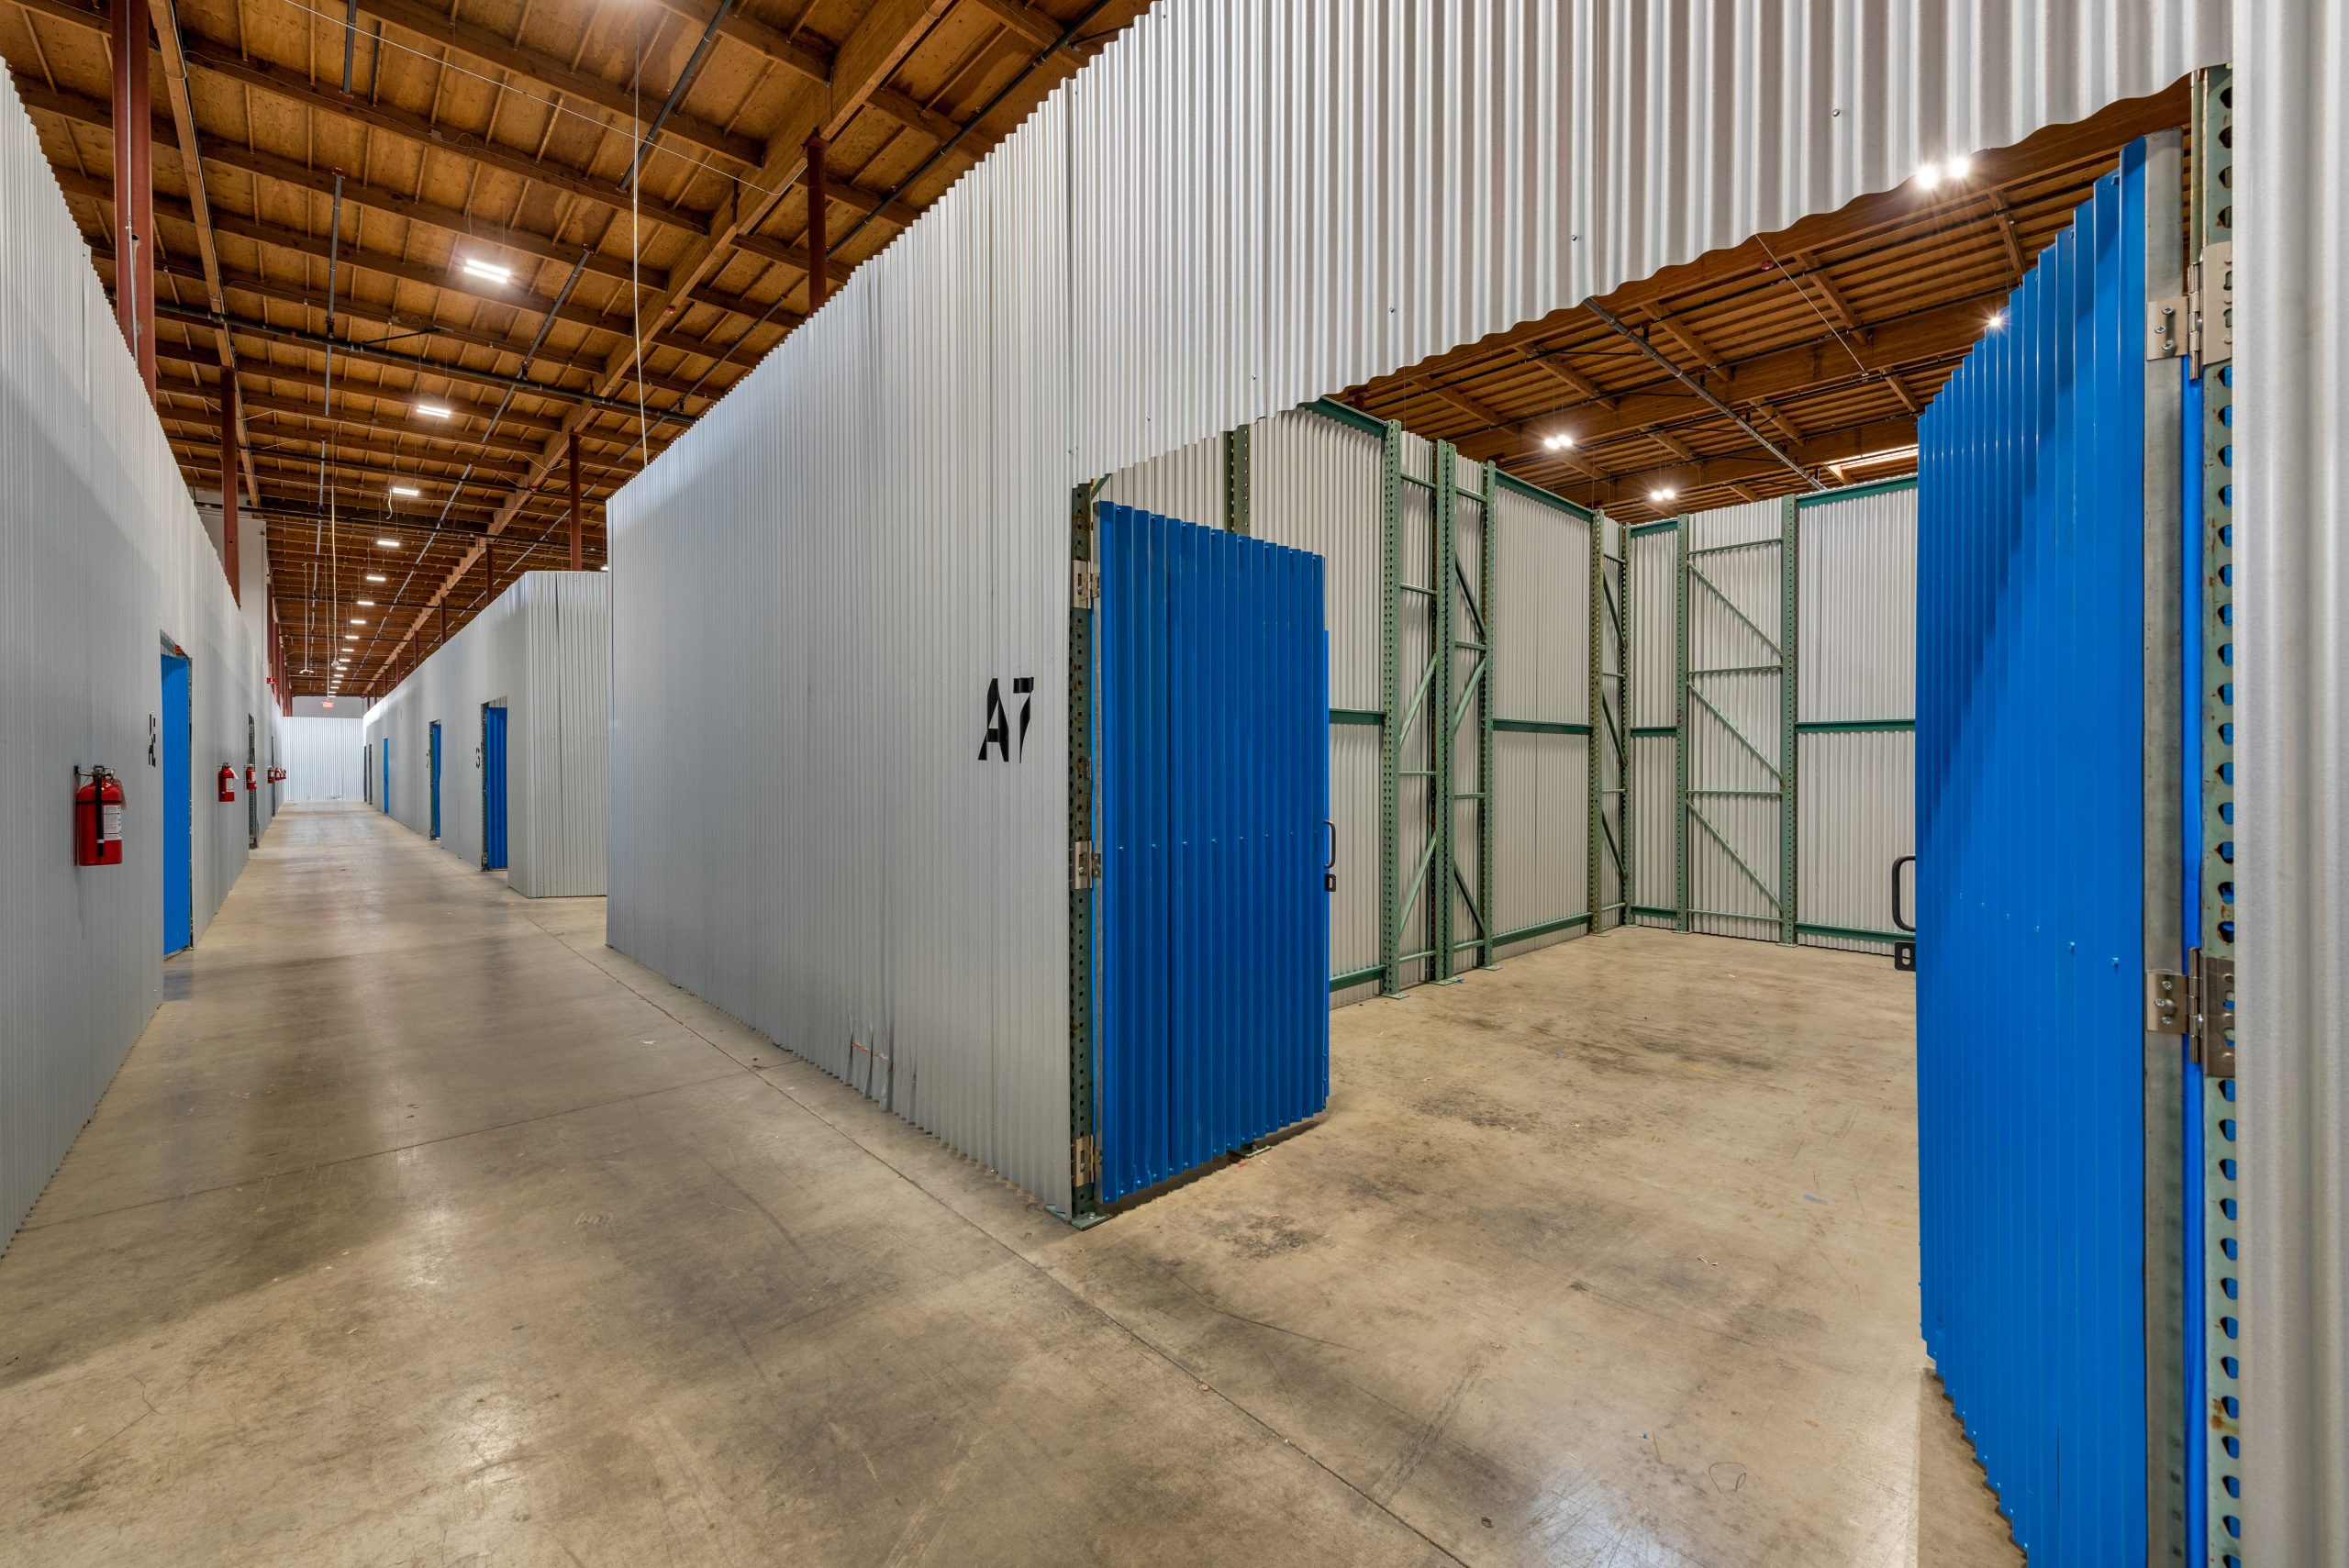
The Bay Area’s flexible warehouse market is defined by scarcity and cost. With developable land extremely limited and demand spanning tech hardware, life science and last-mile logistics, small-bay and flex space near the urban core remains competitive. For the region’s many startups and small businesses, flexible space is often the most practical entry point.
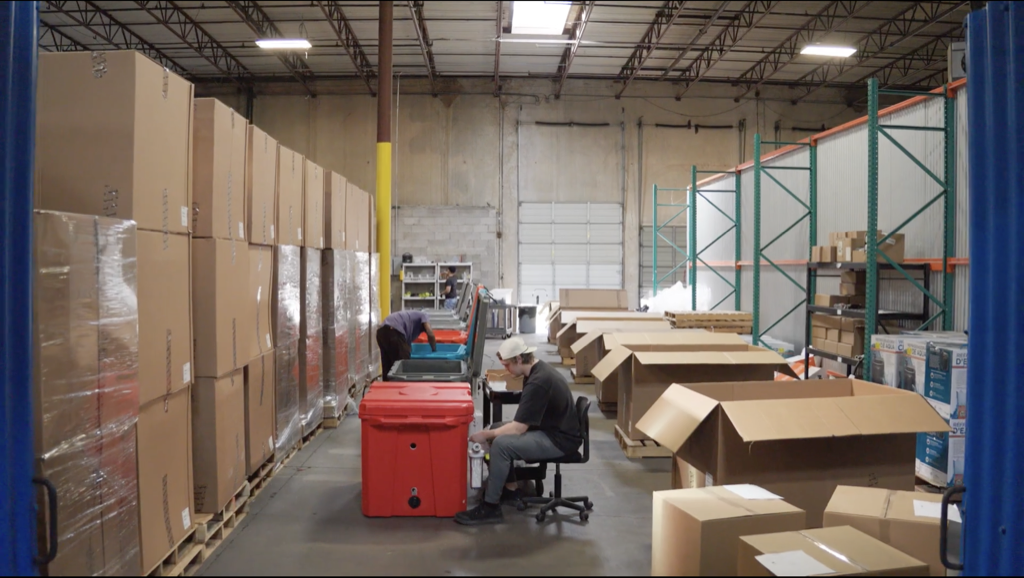
Bay Area flexible space draws hardware and advanced-manufacturing startups, last-mile and e-commerce operators, life science and lab-adjacent users, contractors and building trades, and importers and 3PLs working the Port of Oakland.
Browse available co-warehousing and small-bay warehouse listings on WareCRE’s Bay Area marketplace.
Looking for warehouse space in the Bay Area?
Key Trends to Watch
1. Tech and Advanced Manufacturing Are Pushing North Along the 880 Corridor
C&W reports a spillover of advanced manufacturing, mobility and other technology tenants from Silicon Valley into the East Bay, driven by competition from AI and hyperscaler users for space near Silicon Valley. The East Bay signed four new leases over 100,000 SF in Q2, bringing the year-to-date total to seven, led by Zoox, MiTAC and Quanta. Read more: Small-Bay vs. Big-Box: What the Vacancy Gap Means in 2026.
2. Silicon Valley Absorption Hit Its Highest Level Since 2021
Silicon Valley absorbed about 650,000 SF in Q2, up from 202,000 SF in Q1 and a 56,000 SF loss a year earlier. It was the highest total since Q4 2021. Manufacturing accounted for 459,000 SF and warehouse for 191,000 SF. Fremont led with 324,000 SF, largely from The New IEM’s occupancy of a 215,000 SF warehouse at 47422 Kato Road.
3. Mid-Size Space Is the East Bay’s Weak Spot
The number of East Bay vacancies of 25,000–50,000 SF rose 25.0% over the year, from 68 to 85 spaces, with an even larger increase for spaces of 50,000–100,000 SF. C&W notes that these size ranges have traditionally been the backbone of the market and that their diverse tenant base has been hit harder by economic headwinds than larger users.
Outlook: What to Watch in Q4 2026
C&W’s Q3 2026 MarketBeats are due in mid-October, with the year-end release to follow.
Watch whether East Bay absorption stays positive. Q2’s 65,895 SF gain followed the largest quarterly loss in over 10 years. C&W expects East Bay rental rates to keep declining, though it says the recent uptick in demand may slow that decline.
Watch how fast Silicon Valley absorbs its Q3 deliveries. C&W projects 617,000 SF to deliver next quarter, including 364,000 SF of unleased speculative space, and expects Silicon Valley vacancy to remain low. The pace of lease-up will test that forecast.
Watch whether the two markets keep diverging on rent. East Bay rents are down $0.07 on the year and Silicon Valley rents are up 2.5%. C&W expects pricing for premium Silicon Valley product to keep rising, possibly offset by more sublease space and older assets returning to the market.
Find warehouse space in the Bay Area
Browse co-warehousing, small-bay, and distribution listings across the San Francisco Bay Area.
Data sources: Cushman & Wakefield East Bay Oakland Industrial MarketBeat Q2 2026 and Silicon Valley Industrial MarketBeat Q2 2026 (headline, submarket, leasing and construction figures; rents NNN, $/SF/mo); Cushman & Wakefield U.S. Industrial MarketBeat Q2 2026 (San Francisco Peninsula and North Bay figures, rents published in $/SF/yr); Matthews San Francisco Industrial Market Report Q2 2026, citing CoStar data (cap rate and sale price only). Each report reflects the most recent vacancy, rental, and construction data available at the time of publication. We refresh our reports as new market data is released, and we’re continually expanding coverage to additional metros.
Related Resources
Frequently Asked Questions
What is the current industrial vacancy rate in the Bay Area?
It depends on the market. According to Cushman & Wakefield, East Bay industrial vacancy was 7.8% in Q2 2026 and Silicon Valley vacancy was 6.4%. The San Francisco Peninsula was 4.8% and the North Bay 8.4%. The U.S. average in the same period was 6.9%.
How much does warehouse space cost in the Bay Area?
East Bay industrial asking rents averaged $1.21/SF/mo NNN in Q2 2026, down $0.07 year over year. Silicon Valley averaged $1.63/SF/mo NNN across all sectors, with warehouse space at $1.52 and manufacturing at $1.71. New construction in Fremont is asking well over $1.85, while older Oakland space is closer to $1.00.
What is the San Jose industrial market doing?
Silicon Valley absorbed about 650,000 SF in Q2 2026, its highest total since Q4 2021, and vacancy held at 6.4%. In San Jose, Supermicro leased the newly completed 714,491 SF Bridge Point San Jose in North San Jose, where vacancy is 7.6%, and Nvidia leased 302,775 SF in South San Jose, where vacancy is 9.4%.
How much industrial space is under construction in the Bay Area?
Silicon Valley had about 1.6 million SF under construction at the end of Q2 2026, eight of 12 buildings speculative. The East Bay had 617,353 SF. C&W’s national tables show no construction underway on the San Francisco Peninsula or in the North Bay.
What are industrial cap rates in San Francisco?
Matthews, citing CoStar data for the San Francisco market, reported an average industrial cap rate of 5.9% in Q2 2026, with an average sale price of $440/SF. Cushman & Wakefield’s Bay Area MarketBeats do not publish a cap rate.