Salt Lake City Industrial & Warehouse Market Report | Q2 2026
Key Takeaways
- Salt Lake City industrial vacancy edged down to 7.8% in Q2 2026 from 7.9% in Q1, according to Cushman & Wakefield. It remains 180 basis points above the 6.0% of a year earlier.
- Net absorption strengthened to 519,547 SF in Q2 after 74,506 SF in Q1 (as restated), and new leasing totaled 2,013,359 SF excluding renewals.
- Overall asking rent rose to $10.30/SF/yr NNN (about $0.86/SF/mo), up 7.2% on the quarter and 7.6% on the year.
- 2.1 million SF is under construction, up 4.1% from Q1, while first-half deliveries were light at 140,818 SF.
Browse warehouse space for rent in Salt Lake City
7.8%
Overall Vacancy (Q2 2026)
$10.30
Avg. Asking Rent ($/SF/yr NNN)
520K
SF Net Absorption (Q2 2026)
2.1M
SF Under Construction
Salt Lake City’s industrial market improved in Q2 2026. Net absorption rose to 519,547 SF, the strongest of the five quarters in C&W’s current national tables, and vacancy edged down 10 basis points to 7.8%. Asking rents rose sharply to $10.30/SF/yr NNN. Vacancy is still well above the 6.0% of a year ago, after 1,088,940 SF of negative absorption in Q4 2025.
C&W had not posted its Q2 2026 Salt Lake City MarketBeat when this report was prepared. Metro totals (vacancy, absorption, leasing, asking rent, deliveries and construction) therefore come from the Salt Lake City row of Cushman & Wakefield’s Q2 2026 U.S. Industrial MarketBeat, with Q1 2026 as restated there. Submarket and property-type detail comes from C&W’s Q1 2026 Salt Lake City MarketBeat and is labelled Q1 2026. C&W quotes Salt Lake City rents monthly in its local report and annually in its national tables; this page gives $/SF/yr NNN with the monthly equivalent (annual divided by 12).
Market Snapshot: Q2 2026
| Metric | Q2 2026 | Q1 2026 (restated) | YoY or note |
|---|---|---|---|
| Overall vacancy | 7.8% | 7.9% | +180 bps YoY (6.0% in Q2 2025) |
| Overall asking rent ($/SF/yr NNN) | $10.30 | $9.61 | +7.6% YoY (from $9.57) |
| Monthly equivalent ($/SF/mo NNN) | about $0.86 | about $0.80 | C&W’s local report quotes monthly |
| Net absorption | 519,547 SF | 74,506 SF | 594,053 SF first half |
| New leasing (excl. renewals) | 2,013,359 SF | n/a | Q1 report: 1,219,017 SF |
| Deliveries (year to date) | 140,818 SF | 19,184 SF | Q1 as first published |
| Under construction | 2,054,052 SF | 1,973,286 SF | +4.1% QoQ |
Source: Cushman & Wakefield, U.S. Industrial MarketBeat Q2 2026, Salt Lake City, UT rows (vacancy, absorption, leasing, overall asking rent, deliveries year to date, under construction), with Q1 2026 vacancy, rent and absorption as restated there. Q1 leasing, deliveries and under construction from C&W’s Q1 2026 Salt Lake City MarketBeat. Monthly rents are WareCRE conversions. First-half absorption is the sum of the Q1 and Q2 figures shown. n/a = not published in the Q2 national tables.
Rent Trends: Up 7.2% on the Quarter to $10.30/SF
Salt Lake City’s overall asking rent reached $10.30/SF/yr NNN in Q2 2026, about $0.86/SF/mo, up from $9.61 in Q1 as restated and $9.57 a year earlier. That is a 7.2% quarterly and 7.6% annual gain, after four quarters in which rents stayed between $9.57 and $9.69/SF/yr. The Q2 figure is preliminary in C&W’s national tables.
C&W’s Q1 local report, the latest with property-type detail, showed a split market. Buildings of 10,000 to 100,000 SF posted 3.0% vacancy, while buildings above 100,000 SF were at 9.1%. C&W described “continued upward pressure on small- to mid-size facilities offset by downward pressure on larger W/D properties.” In Q1, office service/flex space asked $1.10/SF/mo, manufacturing $0.88/SF/mo and warehouse/distribution $0.78/SF/mo.
For Tenants
Big-box tenants have options. In Q1, buildings over 100,000 SF held 91% of warehouse/distribution vacancy, and C&W reported landlords in that segment “increasingly offering more aggressive pricing strategies.” Small and mid-size users face a tighter market. Buildings of 10,000 to 100,000 SF were at 3.0% vacancy, and C&W singled out 30,000 to 60,000 SF facilities as especially tight. Search Salt Lake City warehouse listings on WareCRE.
Construction Pipeline: 2.1M SF Underway, Deliveries Light
C&W counted 2,054,052 SF under construction in Salt Lake City at the end of Q2 2026, up from 1,973,286 SF in Q1. Deliveries totaled 140,818 SF in the first half. In Q1 the pipeline spanned 15 buildings and was weighted toward speculative warehouse projects in the Northwest submarket. The largest was 5400 Commerce Center, a three-building project of about 470,000 SF that was fully available for pre-lease.
The larger factor is space already built. C&W reported in Q1 that nearly 8.5 million SF had delivered since early 2024, and about 4.0 million SF of it, or 47%, remained available.
For Operators
C&W’s Q1 outlook expected vacancy to stay stable in the near term and decline in 2027, assuming limited new construction starts. It projected asking rents to “stay relatively flat through 2026.” Q2’s preliminary rent gain runs ahead of that view. Owners of small and mid-size buildings have the most pricing power. Owners of big-box and cross-dock space, where C&W reported slower leasing, should weigh occupancy against rate. C&W also reported strong demand for outdoor storage and for freestanding buildings under 20,000 SF with 1 to 2 acres of yard.
Submarket Breakdown
C&W’s Salt Lake City statistics cover six submarkets, and the Northwest holds about 72% of inventory. Submarket figures below are from C&W’s Q1 2026 Salt Lake City MarketBeat, the latest local release; metro totals above are Q2 2026.
Northwest
118.9 million SF and, in C&W’s words, “the primary hub for large-scale industrial activity in the region.” Vacancy was 8.8% in Q1. The Northwest absorbed 323,985 SF, signed 955,547 SF of leases (78% of the metro total) and had 1,194,704 SF under construction. Asking rents averaged $0.76/SF/mo. The largest move-ins were Hydroblok (225,000 SF at Hamilton Inland Logistics Center) and MEI Rigging & Crafting (173,076 SF at 5600 Logistics Building A).
Central West
18.4 million SF at 7.6% vacancy in Q1. It lost 104,830 SF of occupancy in the quarter and had 470,334 SF under construction. Asking rents averaged $0.93/SF/mo.
South West
14.3 million SF at 5.6% vacancy in Q1, with 140,366 SF of negative absorption and 308,248 SF under construction. Asking rents averaged $1.05/SF/mo. 15567 S. Minuteman Drive (38,287 SF) sold for $7.6 million, or $199/SF.
North East
5.9 million SF at 3.9% vacancy in Q1 and the highest asking rent among the submarkets at $1.23/SF/mo. It posted 87,012 SF of negative absorption and had no construction underway.
| Submarket (Q1 2026) | Vacancy | Asking Rent ($/SF/mo NNN) | YTD Net Absorption (SF) | Under Construction (SF) |
|---|---|---|---|---|
| North West | 8.8% | $0.76 | 323,985 | 1,194,704 |
| Central West | 7.6% | $0.93 | −104,830 | 470,334 |
| South West | 5.6% | $1.05 | −140,366 | 308,248 |
| North East | 3.9% | $1.23 | −87,012 | 0 |
| Central East | 1.4% | $0.87 | 38,876 | 0 |
| South East | 1.1% | n/a | 30,365 | 0 |
| Salt Lake City total (Q1) | 7.9% | $0.80 | 61,018 | 1,973,286 |
Source: Cushman & Wakefield, Salt Lake City Industrial MarketBeat Q1 2026, market statistics table (rents are weighted net asking, all types, $/SF/mo NNN). Q1 totals as first published; the Q2 national tables restate Q1 absorption to 74,506 SF.
C&W tracks two neighboring markets separately. In Q1 2026, Utah County vacancy rose 60 basis points to 6.8%, with asking rents of $1.02/SF/mo NNN, and Northern Utah vacancy rose 50 basis points to 3.1%, with asking rents of $0.93/SF/mo NNN.
Co-Warehousing & Flexible Warehouse Space in Salt Lake City
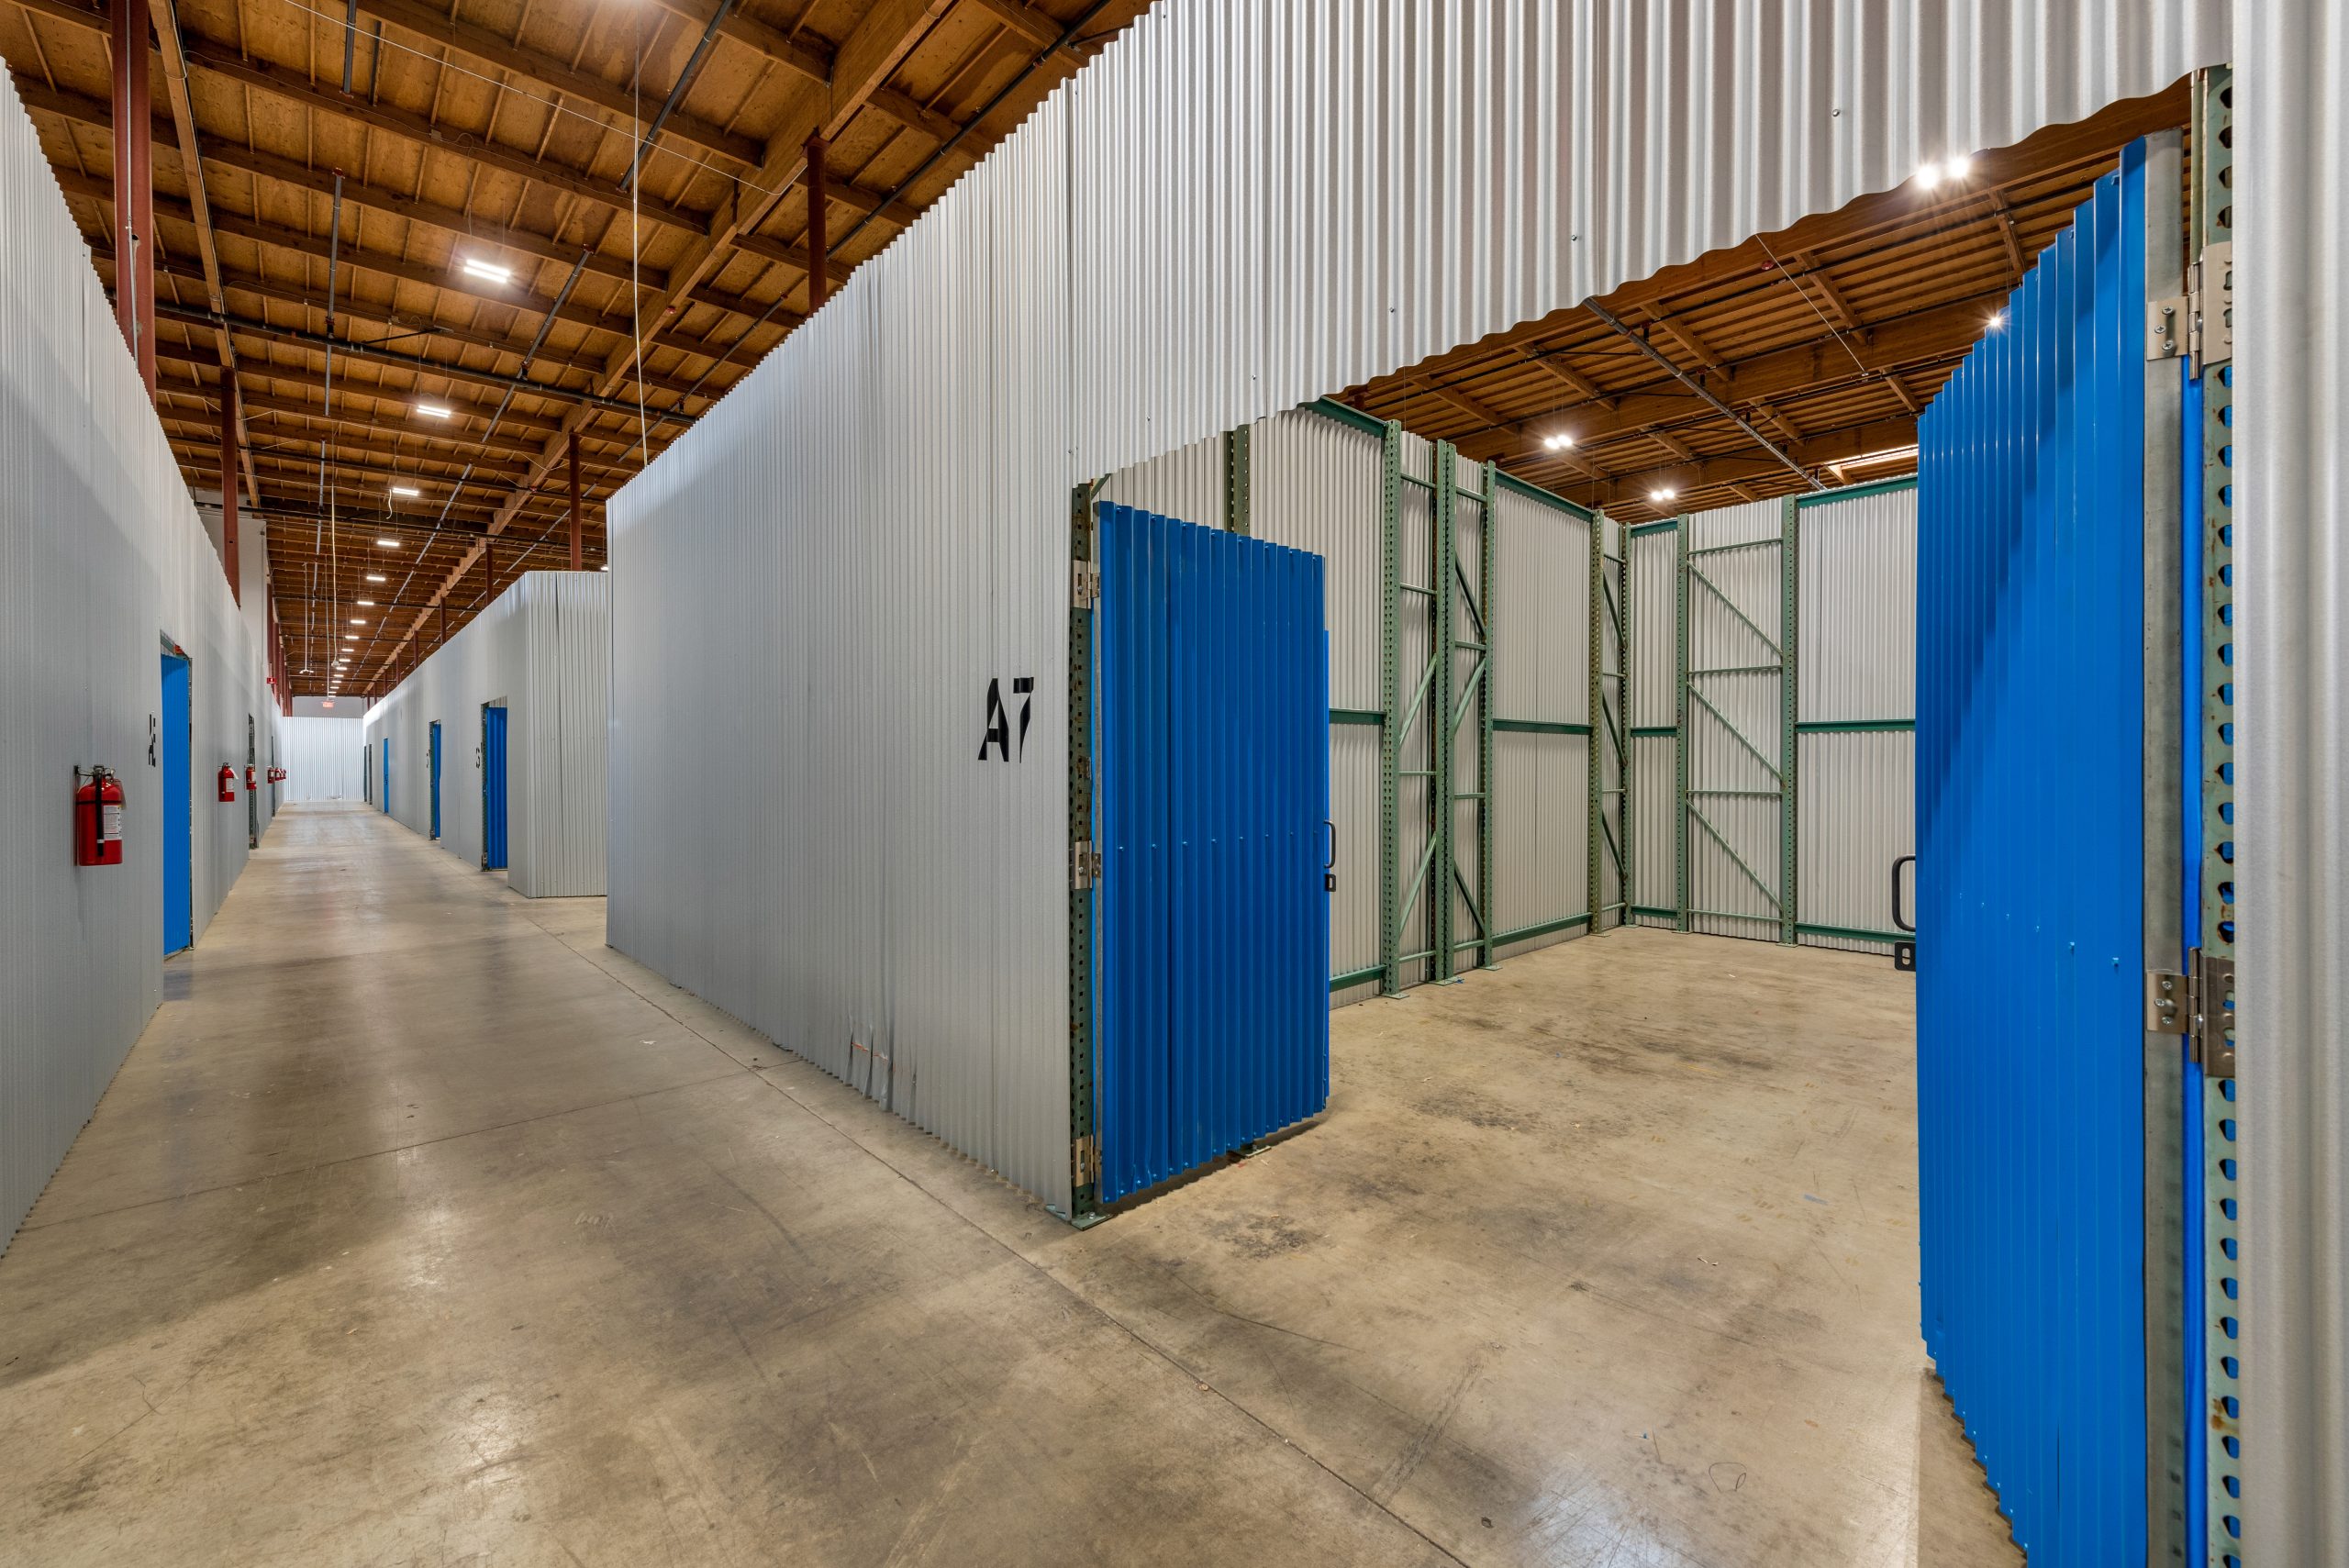
Smaller formats are the tightest part of Salt Lake City’s industrial market. In C&W’s Q1 data, office service/flex vacancy was 2.7% and vacancy in buildings of 10,000 to 100,000 SF was 3.0%. That makes co-warehousing a practical way in for businesses that need space without a long-term commitment.
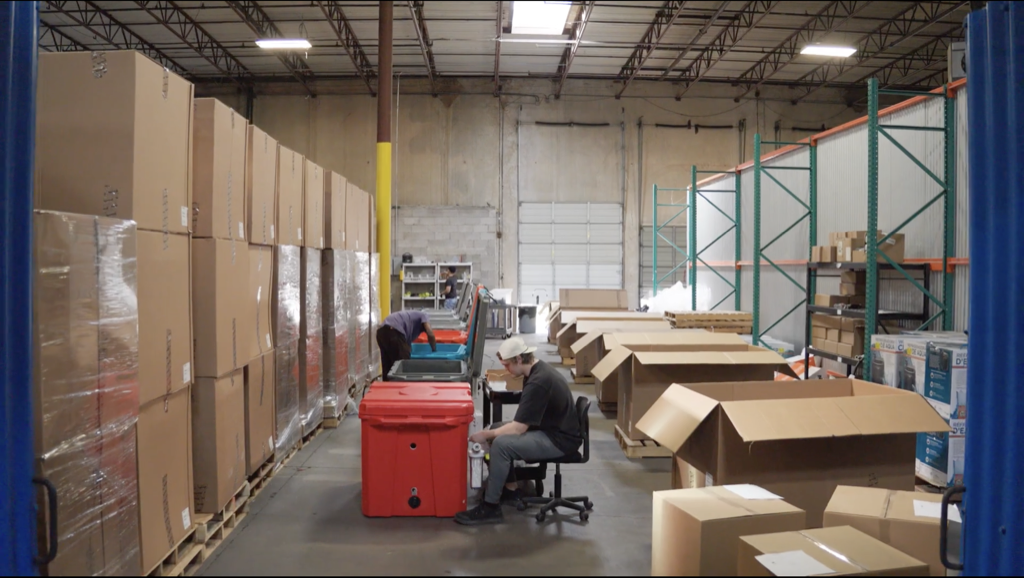
Outdoor recreation and sporting goods brands account for much of Salt Lake City’s flexible-space demand, alongside e-commerce sellers serving the Mountain West. Tech hardware firms, food and beverage distributors and construction trades working along the Wasatch Front also lease short-term space.
Browse available co-warehousing and small-bay warehouse listings on WareCRE’s Salt Lake City marketplace.
Looking for warehouse space in Salt Lake City?
Key Trends to Watch: Salt Lake City Industrial Market Trends 2026
1. Demand Turned Positive After a Weak 2025
Net absorption reached 519,547 SF in Q2, after 262,929 SF of negative absorption in Q3 2025 and 1,088,940 SF in Q4 2025. Leasing picked up too, with 2,013,359 SF of new leases in Q2 compared with about 1.2 million SF in Q1 and the 1.7 million SF quarterly average shown in C&W’s Q1 report.
2. Small and Mid-Size Space Stays Tight
The gap between 3.0% vacancy for 10,000 to 100,000 SF buildings and 9.1% for big boxes (Q1) is the defining feature of the market. C&W reported that freestanding buildings under 20,000 SF with 1 to 2 acres of yard are leasing quickly. Read more: Small-Bay vs. Big-Box: What the Vacancy Gap Means in 2026.
3. Sublease Losses Offset Direct Demand in Q1
In Q1, direct absorption was positive at 411,000 SF but was offset by a 350,000 SF decline in sublease absorption. New sublease offerings included 229,000 SF at 201 Mountain View Park Building 4, formerly occupied by Duluth Holdings. C&W expected sublease availability to show little variation.
Outlook: What to Watch in Q4 2026
C&W’s Q3 2026 MarketBeats are due in mid-October, with the year-end release to follow.
Watch whether the Q2 rent gain holds. The $10.30/SF/yr national figure is preliminary. The next local releases will show which submarkets and property types drove it, and whether C&W still expects flat rents through 2026.
Watch whether absorption stays positive as the 2,054,052 SF pipeline delivers. Q2 absorption was 519,547 SF.
C&W’s Q1 outlook expected vacancy to stay stable near term and decline in 2027. Q2’s 7.8% is a first step, and the next two quarters will test that timeline.
Find warehouse space in Salt Lake City
Browse co-warehousing, small-bay, and distribution listings across the Wasatch Front.
Data sources: Cushman & Wakefield U.S. Industrial MarketBeat Q2 2026, Salt Lake City, UT rows (Q2 2026 metro totals and restated Q1 2026 and Q2 2025 figures; rents NNN, $/SF/yr; U.S. averages); Cushman & Wakefield Salt Lake City Industrial MarketBeat Q1 2026 (submarket, property-type, size-segment, leasing, construction and outlook detail; rents NNN, $/SF/mo); Cushman & Wakefield Utah County and Northern Utah Industrial MarketBeats Q1 2026. C&W’s Q2 2026 Salt Lake City MarketBeat was not available at the time of publication. Each report reflects the most recent vacancy, rental, and construction data available at the time of publication. We refresh our reports as new market data is released, and we’re continually expanding coverage to additional metros.
Related Resources
Frequently Asked Questions
What is the current industrial vacancy rate in Salt Lake City?
Salt Lake City industrial vacancy was 7.8% in Q2 2026, according to Cushman & Wakefield’s Q2 2026 national tables, down 10 basis points from Q1 and up 180 basis points from 6.0% a year earlier. The U.S. average in the same release was 6.9%.
How much does warehouse space cost in Salt Lake City?
The overall average asking rent was $10.30/SF/yr NNN in Q2 2026, about $0.86/SF/mo, up 7.6% year over year. In C&W’s Q1 2026 local report, warehouse/distribution space asked $0.78/SF/mo, manufacturing $0.88/SF/mo and office service/flex $1.10/SF/mo.
Which Salt Lake City submarket is best for warehouse space?
The Northwest holds about 72% of inventory, most of the construction pipeline and 78% of Q1 leasing, with 8.8% vacancy in Q1, so it offers the most choice for large users. Smaller users will find tighter conditions in the North East (3.9%), Central East (1.4%) and South East (1.1%).
How much industrial space is under construction in Salt Lake City?
2,054,052 SF was under construction at the end of Q2 2026, up from 1,973,286 SF in Q1. First-half deliveries totaled 140,818 SF. In Q1 the pipeline spanned 15 buildings, weighted toward speculative warehouse projects in the Northwest.
What are Salt Lake City industrial sale prices?
In Q1 2026, the latest quarter with local detail, C&W’s largest trades were Nuveen’s sales of Landmark V and Landmark VI (190,000 SF each) to MDH Partners at $164/SF each. C&W’s Salt Lake City report does not publish a cap rate.