Omaha Industrial & Warehouse Market Report | Q3 2026
Key Takeaways
- Omaha industrial vacancy rose to 3.5% in Q3 2026 from 2.7% in Q2, according to Cushman & Wakefield, still about half the 6.8% U.S. rate.
- Net absorption reached 1,502,678 SF, but data centers for Meta and Google that delivered fully occupied supplied 1.7 million SF of it. Excluding data centers, absorption was −185,589 SF after Kellogg’s 888,198 SF plant exit.
- The average asking rent was $8.00/SF/yr NNN, up 2.8% on the year. Warehouse/distribution space asks $7.66.
- 2.4 million SF completed in Q3, and the pipeline fell to 1.9 million SF from 3.8 million SF. Sarpy West holds 70% of it.
Browse warehouse space for rent in Omaha
3.5%
Overall Vacancy (Q3 2026)
$8.00
Avg. Asking Rent ($/SF/yr NNN)
1.5M
SF Net Absorption (Q3 2026)
1.9M
SF Under Construction
Data centers drove Omaha’s headline numbers in Q3 2026. Meta’s 1.4 million SF Fairview Road expansion and Google’s 288,267 SF Blair High Road facility delivered fully occupied, lifting net absorption to 1,502,678 SF. Excluding them, the market gave back 185,589 SF as Kellogg’s left its F Street plant, and overall vacancy rose to 3.5%. Warehouse/distribution space stayed tight at 2.1%.
Figures on this page are from the Cushman & Wakefield Alliance Q3 2026 Omaha Industrial MarketBeat unless noted. Rents are triple net (NNN) asking rents in $/SF/yr. Our Q2 edition used NAI NP Dodge figures because C&W had not updated Omaha for Q2; those figures come from a different dataset and are not comparable with the C&W figures below. C&W counts fully occupied data center buildings in its flex inventory, which affects absorption, completions and flex vacancy.
Market Snapshot: Q3 2026
| Metric | Q3 2026 | Q2 2026 (per Q3 reports) | YoY or note |
|---|---|---|---|
| Overall vacancy | 3.5% | 2.7% | +50 bps YoY (3.0% in Q3 2025); W/D 2.1%, flex 3.1%, manufacturing 7.9% |
| Overall asking rent ($/SF/yr NNN) | $8.00 | $7.97 | +2.8% YoY (from $7.78); W/D $7.66 |
| Net absorption | 1,502,678 SF | 416,049 SF | −185,589 SF excluding data centers; 2,963,838 SF year to date |
| Under construction | 1,922,831 SF | 3.8M SF | 70% in Sarpy West |
| Inventory | 118.2M SF | n/a | 2.4M SF completed in Q3; 2.9M SF year to date |
Source: Cushman & Wakefield Alliance, Omaha Industrial MarketBeat Q3 2026. Q2 vacancy and pipeline as stated in that report; Q2 rent and absorption and Q3 2025 figures from C&W’s U.S. Industrial MarketBeat Q3 2026 metro tables, which show Q2 vacancy at 1.3%.
Rent Trends: $8.00/SF NNN, Up 2.8% on the Year
C&W’s average asking rent was $8.00/SF/yr NNN in Q3 2026, up from $7.97 in Q2 and $7.78 a year earlier. Warehouse/distribution space asks $7.66 and office service/flex $8.74. Omaha rents are about 23% below C&W’s U.S. average of $10.40/SF/yr (WareCRE calculation).
Rents vary widely by submarket. Among the four largest, overall averages run from $7.30/SF/yr in Northeast Omaha to $10.25 in Northwest Omaha, and Sarpy West, where most new buildings are, averages $9.18.
For Tenants
Warehouse vacancy of 2.1% still leaves few options, and rents are rising. The largest speculative completion of the quarter, the 286,000 SF R&R Commerce Park South Warehouse IV at 15415 Sunburst Drive, is leased to Amazon. Older manufacturing space is the exception: the Kellogg’s plant at 9601 F Street adds 888,198 SF to the market. Start searches early and consider flexible space while you plan a long-term move. Search Omaha warehouse listings on WareCRE.
Construction Pipeline: 1.9M SF After a 2.4M SF Delivery Quarter
C&W counts 1,922,831 SF under construction at the end of Q3, down from 3.8 million SF in Q2 after 2.4 million SF completed during the quarter. Warehouse/distribution accounts for 1.2 million SF of the pipeline, data centers 373,497 SF and non-data center flex 314,855 SF. Sarpy West holds 1.4 million SF, or 70%.
Data centers made up 1.7 million SF, or 71%, of Q3 completions. The remaining 691,046 SF included 326,954 SF of build-to-suit and 364,092 SF of speculative space. Year-to-date deliveries total 2.9 million SF.
For Operators
Owners of warehouse space are still in a strong position at 2.1% vacancy, and rents are up 2.8% on the year. Two risks stand out. Excluding data centers, absorption was negative in Q3, and the Kellogg’s closure lifted manufacturing vacancy to 7.9%. South Central Omaha also posted −865,706 SF of net absorption in Q3, and its vacancy rose to 6.0%.
Submarket Breakdown
C&W’s Q3 2026 Omaha MarketBeat tracks 18 submarkets. The four below account for most of the metro’s inventory, absorption and construction.
Sarpy West (I-80)
The largest submarket at 31.2 million SF and the center of new development. It absorbed 1,706,835 SF in Q3, including Meta’s 1.4 million SF Fairview Road data center expansion, which delivered fully occupied, and Amazon’s 286,000 SF lease at 15415 Sunburst Drive. Vacancy is 1.7%, and 1,350,273 SF is under construction, about 70% of the metro pipeline. Capital Sanitary leased 49,500 SF at 9061 S 126th Street.
South Central Omaha
A 22.6 million SF established industrial area. It posted −865,706 SF of net absorption in Q3, the largest loss in the metro, and its vacancy rose to 6.0%. International Paper renewed 82,470 SF at 4019 S 60th Street. Nothing is under construction.
Northeast Omaha
An 11.7 million SF submarket with 5.1% vacancy and the lowest average rent of the four, $7.30/SF/yr. It absorbed 31,176 SF in Q3, but year-to-date absorption is −471,367 SF. Nothing is under construction.
Northwest Omaha
A 9.7 million SF submarket with 1.6% vacancy. It absorbed 465,918 SF in Q3 as Google’s 288,267 SF Blair High Road data center delivered fully occupied, and it has 289,061 SF under construction. Its average rent of $10.25/SF/yr is among the highest in the metro.
| Submarket (C&W, Q3 2026) | Vacancy | Asking Rent, All Uses ($/SF/yr NNN) | YTD Net Absorption (SF) | Under Construction (SF) |
|---|---|---|---|---|
| Sarpy West | 1.7% | $9.18 | 2,615,251 | 1,350,273 |
| South Central Omaha | 6.0% | $8.73 | -736,653 | 0 |
| Northeast Omaha | 5.1% | $7.30 | -471,367 | 0 |
| Northwest Omaha | 1.6% | $10.25 | 647,105 | 289,061 |
| Southwest Omaha | 2.4% | $7.51 | -30,075 | 0 |
| Southeast Omaha | 5.0% | $7.65 | 14,265 | 0 |
| Council Bluffs (IA) | 0.4% | n/a | 92,000 | 283,497 |
| Omaha total (C&W) | 3.5% | $8.00 | 2,963,838 | 1,922,831 |
Source: Cushman & Wakefield Alliance, Omaha Industrial MarketBeat Q3 2026, market statistics table (overall asking rent, NNN). Smaller outlying submarkets are included in the total but not shown.
Co-Warehousing & Flexible Warehouse Space in Omaha
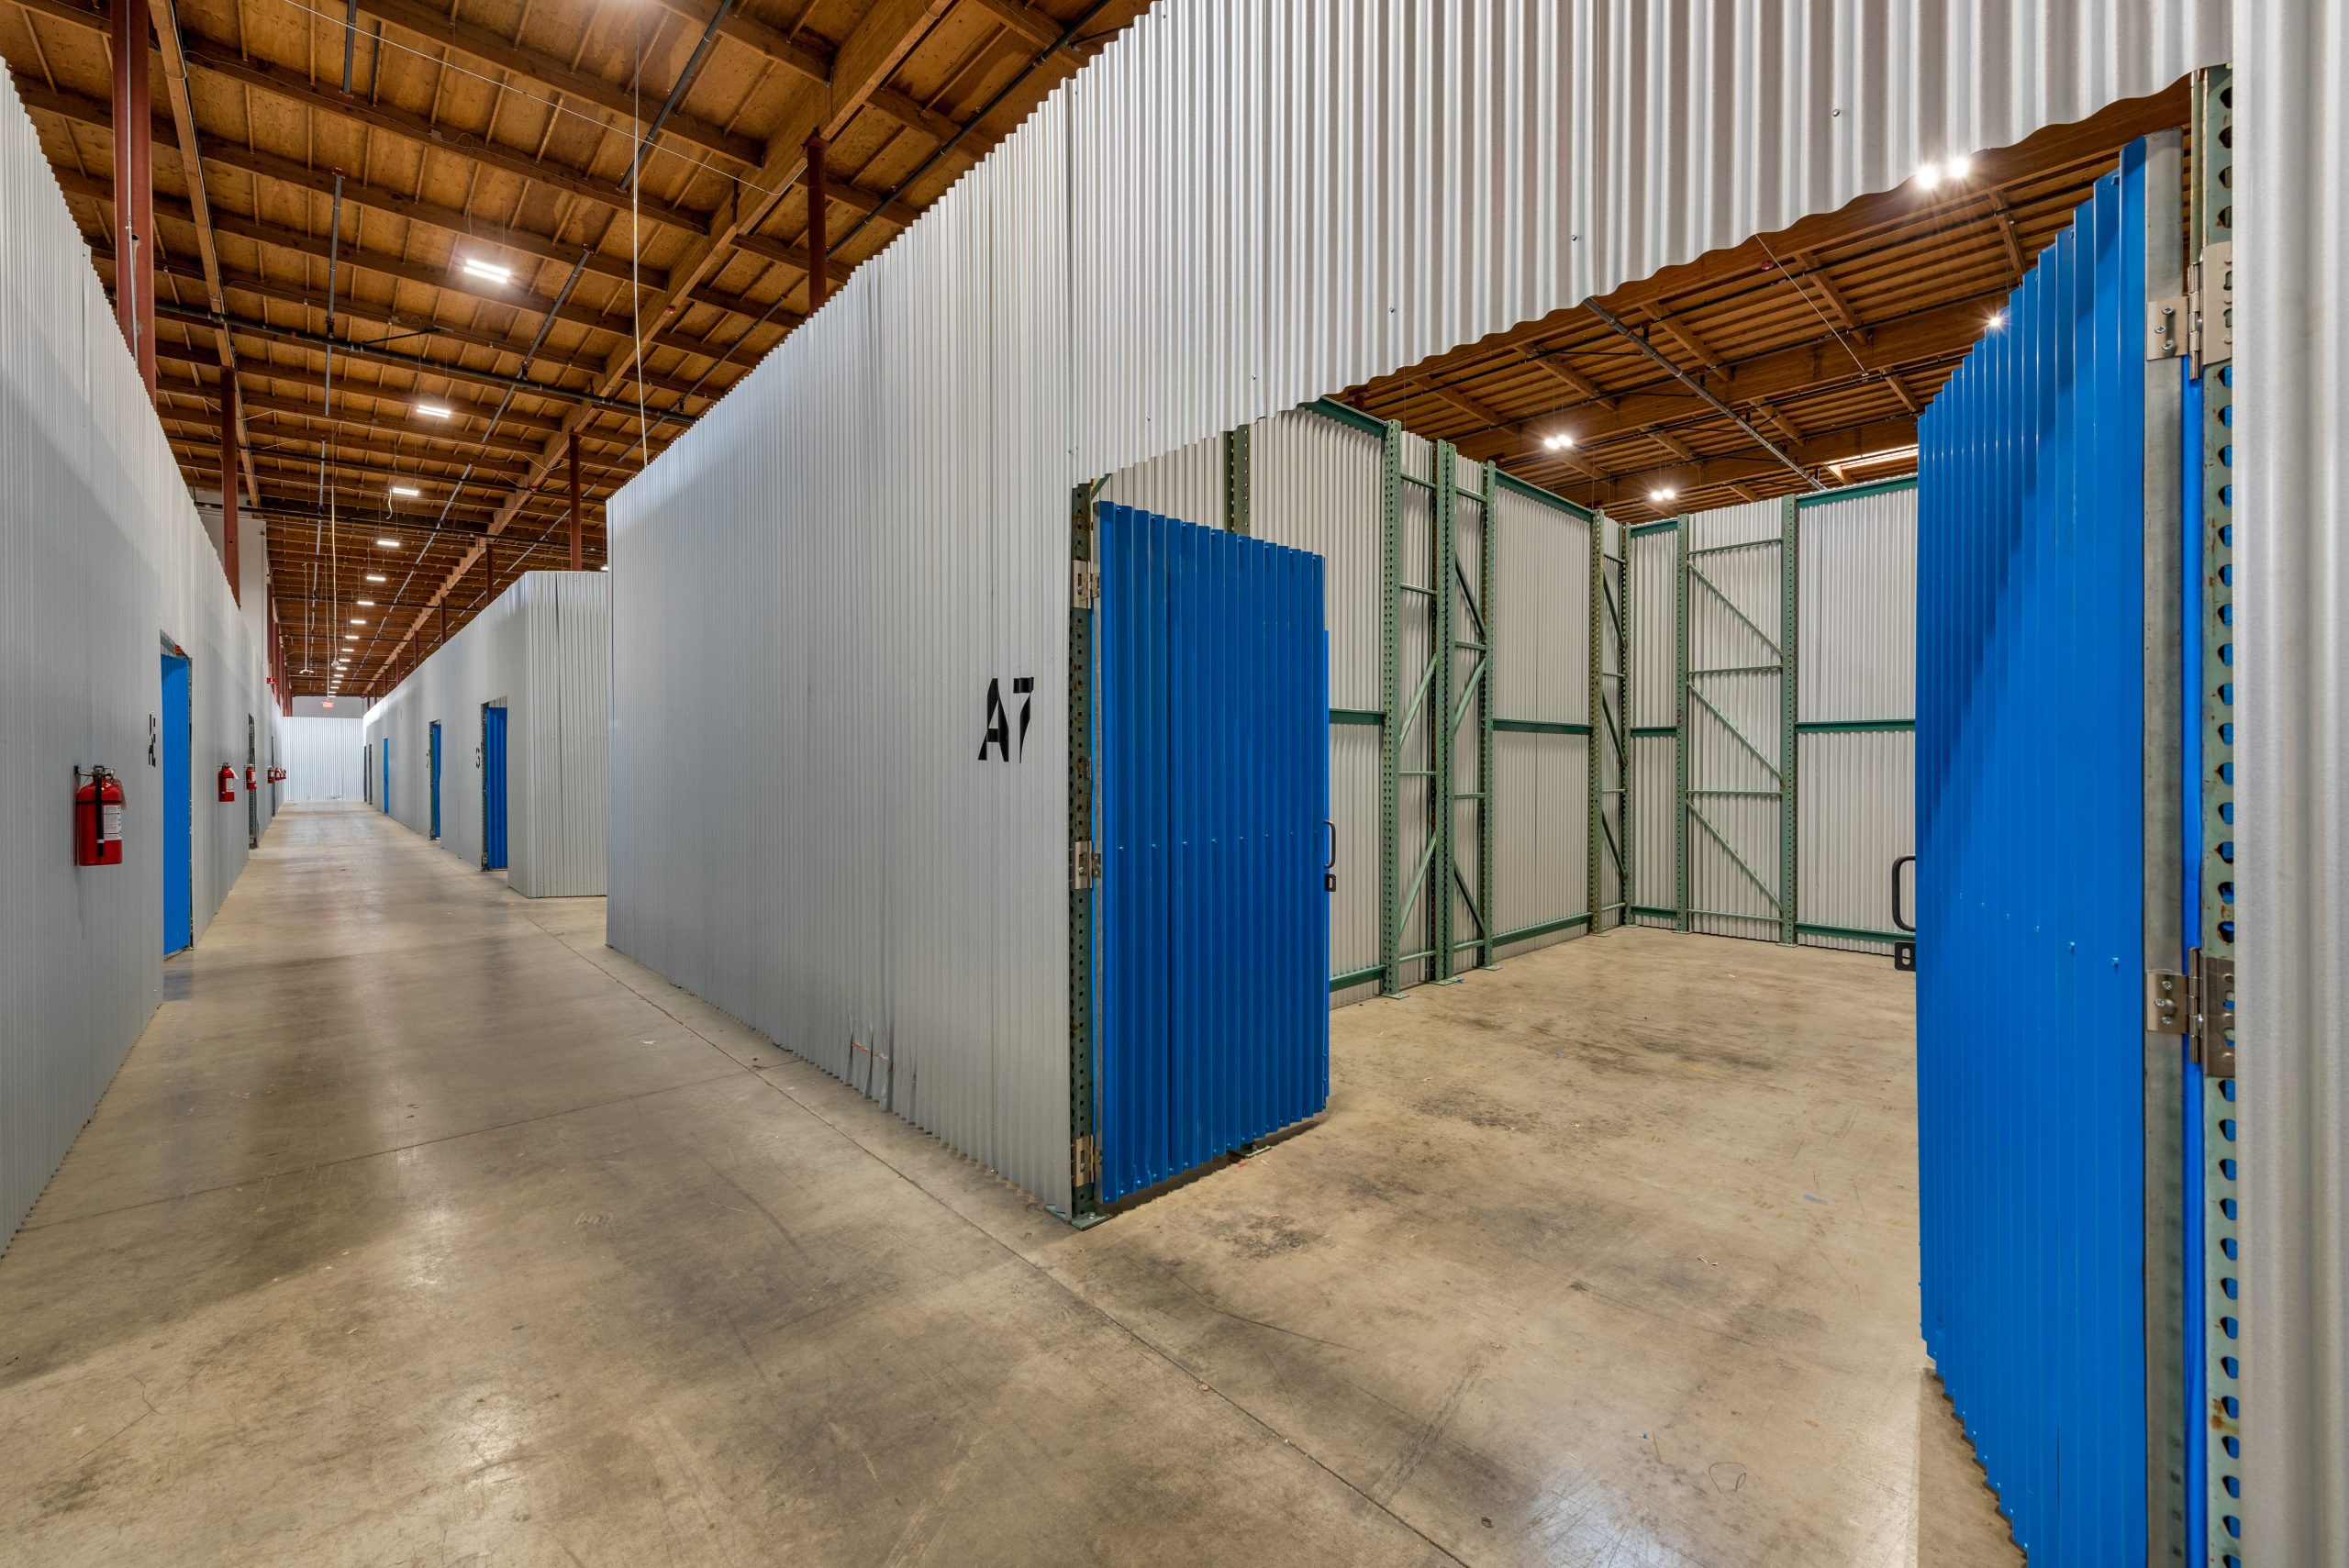
With warehouse vacancy at 2.1%, flexible and co-warehousing space gives businesses a way to get warehouse access without waiting for a traditional lease to open up. In C&W’s Q3 figures, office service/flex space asks $8.74/SF/yr NNN, and flex vacancy excluding data centers is 5.1%.
Omaha’s flexible-space demand comes largely from food and cold-chain companies and from e-commerce businesses serving Midwest consumers. Agricultural technology and farm supply firms, construction trades and growing businesses that want scalable space without long-term commitments also lease it.
Browse available co-warehousing and small-bay warehouse listings on WareCRE’s Omaha marketplace.
Looking for warehouse space in Omaha?
Key Trends to Watch
1. Data Centers Are Driving the Headline Numbers
Meta’s 1.4 million SF Fairview Road expansion and Google’s 288,267 SF Blair High Road facility delivered fully occupied in Q3, contributing 1.7 million SF of absorption and 71% of completions. C&W counts 10.3 million SF of the 26.0 million SF flex base as fully occupied data center space. Without data centers, Q3 absorption was −185,589 SF. For broader context: Industrial Real Estate Trends & Outlook 2026.
2. Sarpy West Is Where New Supply and Leasing Are Concentrated
Sarpy West holds 70% of the space under construction and absorbed 1,706,835 SF in Q3, including Amazon’s 286,000 SF lease. Tenants that need modern space with I-80 access will find most of the new options in this one submarket. Read more: Small-Bay vs. Big-Box: What the Vacancy Gap Means in 2026.
3. Kellogg’s Exit Adds a Large Manufacturing Vacancy
Kellogg’s left 888,198 SF at 9601 F Street, pushing manufacturing absorption to −876,402 SF and manufacturing vacancy to 7.9%. C&W calls manufacturing the soft spot in Omaha’s economy, even as payroll employment rose 1.1% on the year to 525,500 jobs and unemployment eased to 2.9%.
Outlook: What to Watch in Early 2027
C&W’s year-end 2026 MarketBeats are expected in mid-January. Three readings matter most.
Watch absorption excluding data centers. It was −185,589 SF in Q3, and a return to positive territory would show that warehouse demand is outrunning manufacturing losses.
Watch the Kellogg’s plant. How quickly the 888,198 SF at 9601 F Street finds a user will move manufacturing vacancy, now 7.9%, more than any other single building.
Watch the remaining pipeline. With 1,922,831 SF under construction, 1.2 million SF of it warehouse/distribution, the share that delivers vacant will decide whether warehouse vacancy stays near 2%.
Find warehouse space in Omaha
Browse co-warehousing, small-bay, and distribution listings across the Omaha metro.
Data sources: Cushman & Wakefield Alliance Omaha Industrial MarketBeat Q3 2026 (headline, product-type, submarket and pipeline figures; rents NNN asking, $/SF/yr); Cushman & Wakefield U.S. Industrial MarketBeat Q3 2026 (Q2 rent and absorption, Q3 2025 comparisons and U.S. averages). Each report reflects the most recent vacancy, rental, and construction data available at the time of publication. We refresh our reports as new market data is released, and we’re continually expanding coverage to additional metros.
Related Resources
Frequently Asked Questions
What is the current industrial vacancy rate in Omaha?
Omaha industrial vacancy was 3.5% in Q3 2026, according to Cushman & Wakefield, up from 2.7% in Q2. Warehouse/distribution vacancy was 2.1%, flex 3.1% and manufacturing 7.9%. The overall rate is about half the U.S. rate of 6.8%.
How much does warehouse space cost in Omaha?
C&W’s average asking rent was $8.00/SF/yr NNN in Q3 2026, up 2.8% year over year. Warehouse/distribution space asked $7.66 and office service/flex $8.74. Among the larger Omaha submarkets, overall averages ranged from $7.30/SF/yr in Northeast Omaha to $10.25 in Northwest Omaha.
Which Omaha submarket is best for warehouse space?
For modern distribution space, Sarpy West along I-80 has the most new construction and led Q3 absorption. Northwest Omaha is tight at 1.6% vacancy. South Central and Northeast Omaha have the most vacant space among the four largest submarkets, and Council Bluffs gives Iowa-side options.
How much industrial space is under construction in Omaha?
C&W counted 1,922,831 SF under construction at the end of Q3 2026, down from 3.8 million SF in Q2 after 2.4 million SF completed. Sarpy West holds 70% of the pipeline, and warehouse/distribution accounts for 1.2 million SF.
What are the Omaha industrial market trends in 2026?
Data centers dominate the headline numbers. Meta and Google facilities delivered fully occupied in Q3, lifting absorption to 1,502,678 SF, while the market excluding data centers gave back 185,589 SF after Kellogg’s plant closure. Vacancy rose to 3.5%, rents are up 2.8% on the year, and new supply is concentrated in Sarpy West.