Chicago Industrial & Warehouse Market Report | Q2 2026
Key Takeaways
- Chicago industrial vacancy held at 4.8% in Q2 2026 for a third straight quarter, up just 10 basis points year over year and well below the U.S. average of 6.9%.
- Net absorption rose to 3.3 million SF in Q2 from 1.8 million SF in Q1, and new leasing reached 21.8 million SF in the first half, up 11.1% and the highest mid-year total since 2022.
- Overall asking rents averaged $7.55/SF/yr NNN, up 0.9% year over year. Warehouse/distribution space asks $7.16/SF/yr.
- 13.9 million SF is under construction, roughly double a year earlier, and speculative deliveries jumped 270.2% year over year as developers returned to spec building.
Browse warehouse space for rent in Chicago
4.8%
Overall Vacancy (Q2 2026)
$7.55
Avg. Asking Rent ($/SF/yr NNN)
3.3M
SF Net Absorption (Q2 2026)
13.9M
SF Under Construction
Chicago’s industrial market picked up speed in Q2 2026. Net absorption rose to 3.3 million SF, up 79.3% from Q1 as restated, and new leasing climbed to 11.6 million SF. Vacancy held at 4.8% for a third straight quarter. The bigger change is on the supply side, where speculative construction is growing again.
Figures are from Cushman & Wakefield’s Q2 2026 Chicago Industrial MarketBeat unless noted. Prior-quarter and year-ago comparisons use the figures as restated in C&W’s Q2 2026 U.S. Industrial MarketBeat tables. Rents are net asking, quoted in $/SF/yr.
Market Snapshot: Q2 2026
| Metric | Q2 2026 | Q1 2026 (restated) | YoY or note |
|---|---|---|---|
| Overall vacancy | 4.8% | 4.8% | +10 bps YoY (4.7% in Q2 2025) |
| Overall asking rent ($/SF/yr NNN) | $7.55 | $7.34 | +0.9% YoY (from $7.48) |
| Warehouse/distribution asking rent ($/SF/yr) | $7.16 | n/a | Manufacturing $7.58; office service/flex $11.32 |
| Net absorption | 3.3M SF | 1.8M SF | 5.1M SF year to date |
| New leasing activity | 11.6M SF | 10.2M SF | 21.8M SF year to date, +11.1% YoY |
| Deliveries | 5.9M SF year to date | n/a | Quarter-only figure not published |
| Under construction | 13.9M SF | n/a | Statistics table; C&W’s narrative cites 13.5M SF |
| Vacant sublease space | 4.6M SF | n/a | 7.2% of vacant space; +5.6% YoY |
| Inventory | 1.31B SF | n/a | Base for all rates above |
Source: Cushman & Wakefield, Chicago Industrial MarketBeat Q2 2026. Q1 2026 and Q2 2025 values as restated in C&W’s U.S. Industrial MarketBeat Q2 2026 metro tables and in the Chicago report. n/a = not restated in the Q2 reports.
Rent Trends: Up 0.9% Metro-Wide, Sharp Gains in a Few Submarkets
Chicago’s overall asking rent averaged $7.55/SF/yr NNN in Q2 2026, up 0.9% year over year. Warehouse/distribution space asks $7.16/SF/yr, manufacturing $7.58 and office service/flex $11.32. Chicago rents sit well under the U.S. overall average of $10.32/SF/yr.
The metro average hides wide differences. Annual rent growth was reported in 15 of the 20 submarkets. Southern DuPage led with asking rents up 58.5% to $12.54/SF/yr, followed by Western Kane County, up 23.1% to $9.00, and the Interstate 80 Corridor, up 13.3% to $7.00. C&W expects strong leasing and a growing pipeline to “sustain upward pressure on rental rates.”
For Tenants
Chicago is tight but not uniform. Metro vacancy is 4.8%, and Southern DuPage sits at 0.8%. The Interstate 80 and Interstate 55 corridors, both at 6.2%, offer the most choice for big-box users as new speculative buildings deliver. With vacant sublease space at 4.6 million SF, sublease options are worth checking for shorter commitments. Search Chicago warehouse listings on WareCRE.
Construction Pipeline: 13.9M SF Underway as Spec Building Returns
C&W’s statistics table shows 13.9 million SF under construction at the end of Q2 2026; its narrative rounds the pipeline to 13.5 million SF, nearly double the 6.7 million SF of a year earlier. Of that pipeline, 7.2 million SF is speculative and 6.3 million SF build-to-suit. Sixteen projects broke ground in Q2, up from five in the prior quarter. Projects underway average 306,000 SF across 44 facilities, and six exceed 500,000 SF, two of them speculative.
The mix has shifted. Speculative deliveries reached 3.6 million SF across 14 buildings in the first half, up 270.2% year over year, while build-to-suit deliveries fell 53.7% to 2.4 million SF. The Interstate 80 Corridor and Northwest Indiana hold 52.3% of the pipeline, or 7.3 million SF. Two build-to-suit projects at Elion Logistics Park 55, Kimberly-Clark’s 1.5 million SF distribution center and Greenbox Systems’ 1.1 million SF facility, drive much of that activity.
For Operators
A 4.8% vacancy rate and rising leasing support holding rate on well-located product. New competition is the risk, with speculative deliveries up sharply and 7.2 million SF of speculative space under construction. C&W reads the uptick in speculative groundbreakings as a sign of developer confidence, but owners of big-box space in the south and southwest corridors will face more competing product in the coming quarters.
Submarket Breakdown: Interstate 80 Leads Absorption, Leasing and Construction
C&W tracks 20 Chicago submarkets. The four below are the largest by inventory or the most active in Q2 2026.
Interstate 80 Corridor
The metro’s demand leader, at 128.2 million SF, has 6.2% vacancy, 2.9 million SF of net absorption year to date and 5.1 million SF of new leasing. It also has the largest pipeline of any submarket at 4.7 million SF. KeHE Distributors’ 1,195,754 SF lease and Hyundai Translead’s 906,517 SF lease both landed here in Q2. Warehouse space asks $8.77/SF/yr.
Interstate 55 Corridor
Chicago’s established big-box corridor southwest of the city covers 110.1 million SF at 6.2% vacancy, with 1.7 million SF of net absorption and 3.7 million SF of new leasing year to date. Warehouse space asks $7.42/SF/yr, and 1.1 million SF is under construction.
O’Hare
The close-in, airport-oriented infill market at 97.5 million SF. Vacancy is 4.2% and warehouse space asks $9.60/SF/yr, the highest of the four profiled here. Net absorption was a modest 46,908 SF year to date, and 1.2 million SF is under construction.
Chicago South
The largest submarket by inventory at 133.4 million SF, with vacancy below the metro average at 3.6%. Warehouse space asks $7.03/SF/yr, net absorption reached 218,506 SF year to date, and 1.0 million SF is under construction.
| Submarket | Vacancy | W/D Asking Rent ($/SF/yr) | YTD Net Absorption (SF) | Under Construction (SF) |
|---|---|---|---|---|
| Interstate 80 Corridor | 6.2% | $8.77 | 2,943,729 | 4,704,719 |
| Interstate 55 Corridor | 6.2% | $7.42 | 1,699,285 | 1,114,471 |
| O’Hare | 4.2% | $9.60 | 46,908 | 1,167,172 |
| Chicago South | 3.6% | $7.03 | 218,506 | 1,035,770 |
| Southern Fox Valley | 4.8% | $6.84 | -554,801 | 1,242,905 |
| South Suburbs | 4.6% | $5.36 | 115,187 | 0 |
| Chicago total | 4.8% | $7.16 | 5,135,293 | 13,864,888 |
Source: Cushman & Wakefield, Chicago Industrial MarketBeat Q2 2026, market statistics table.
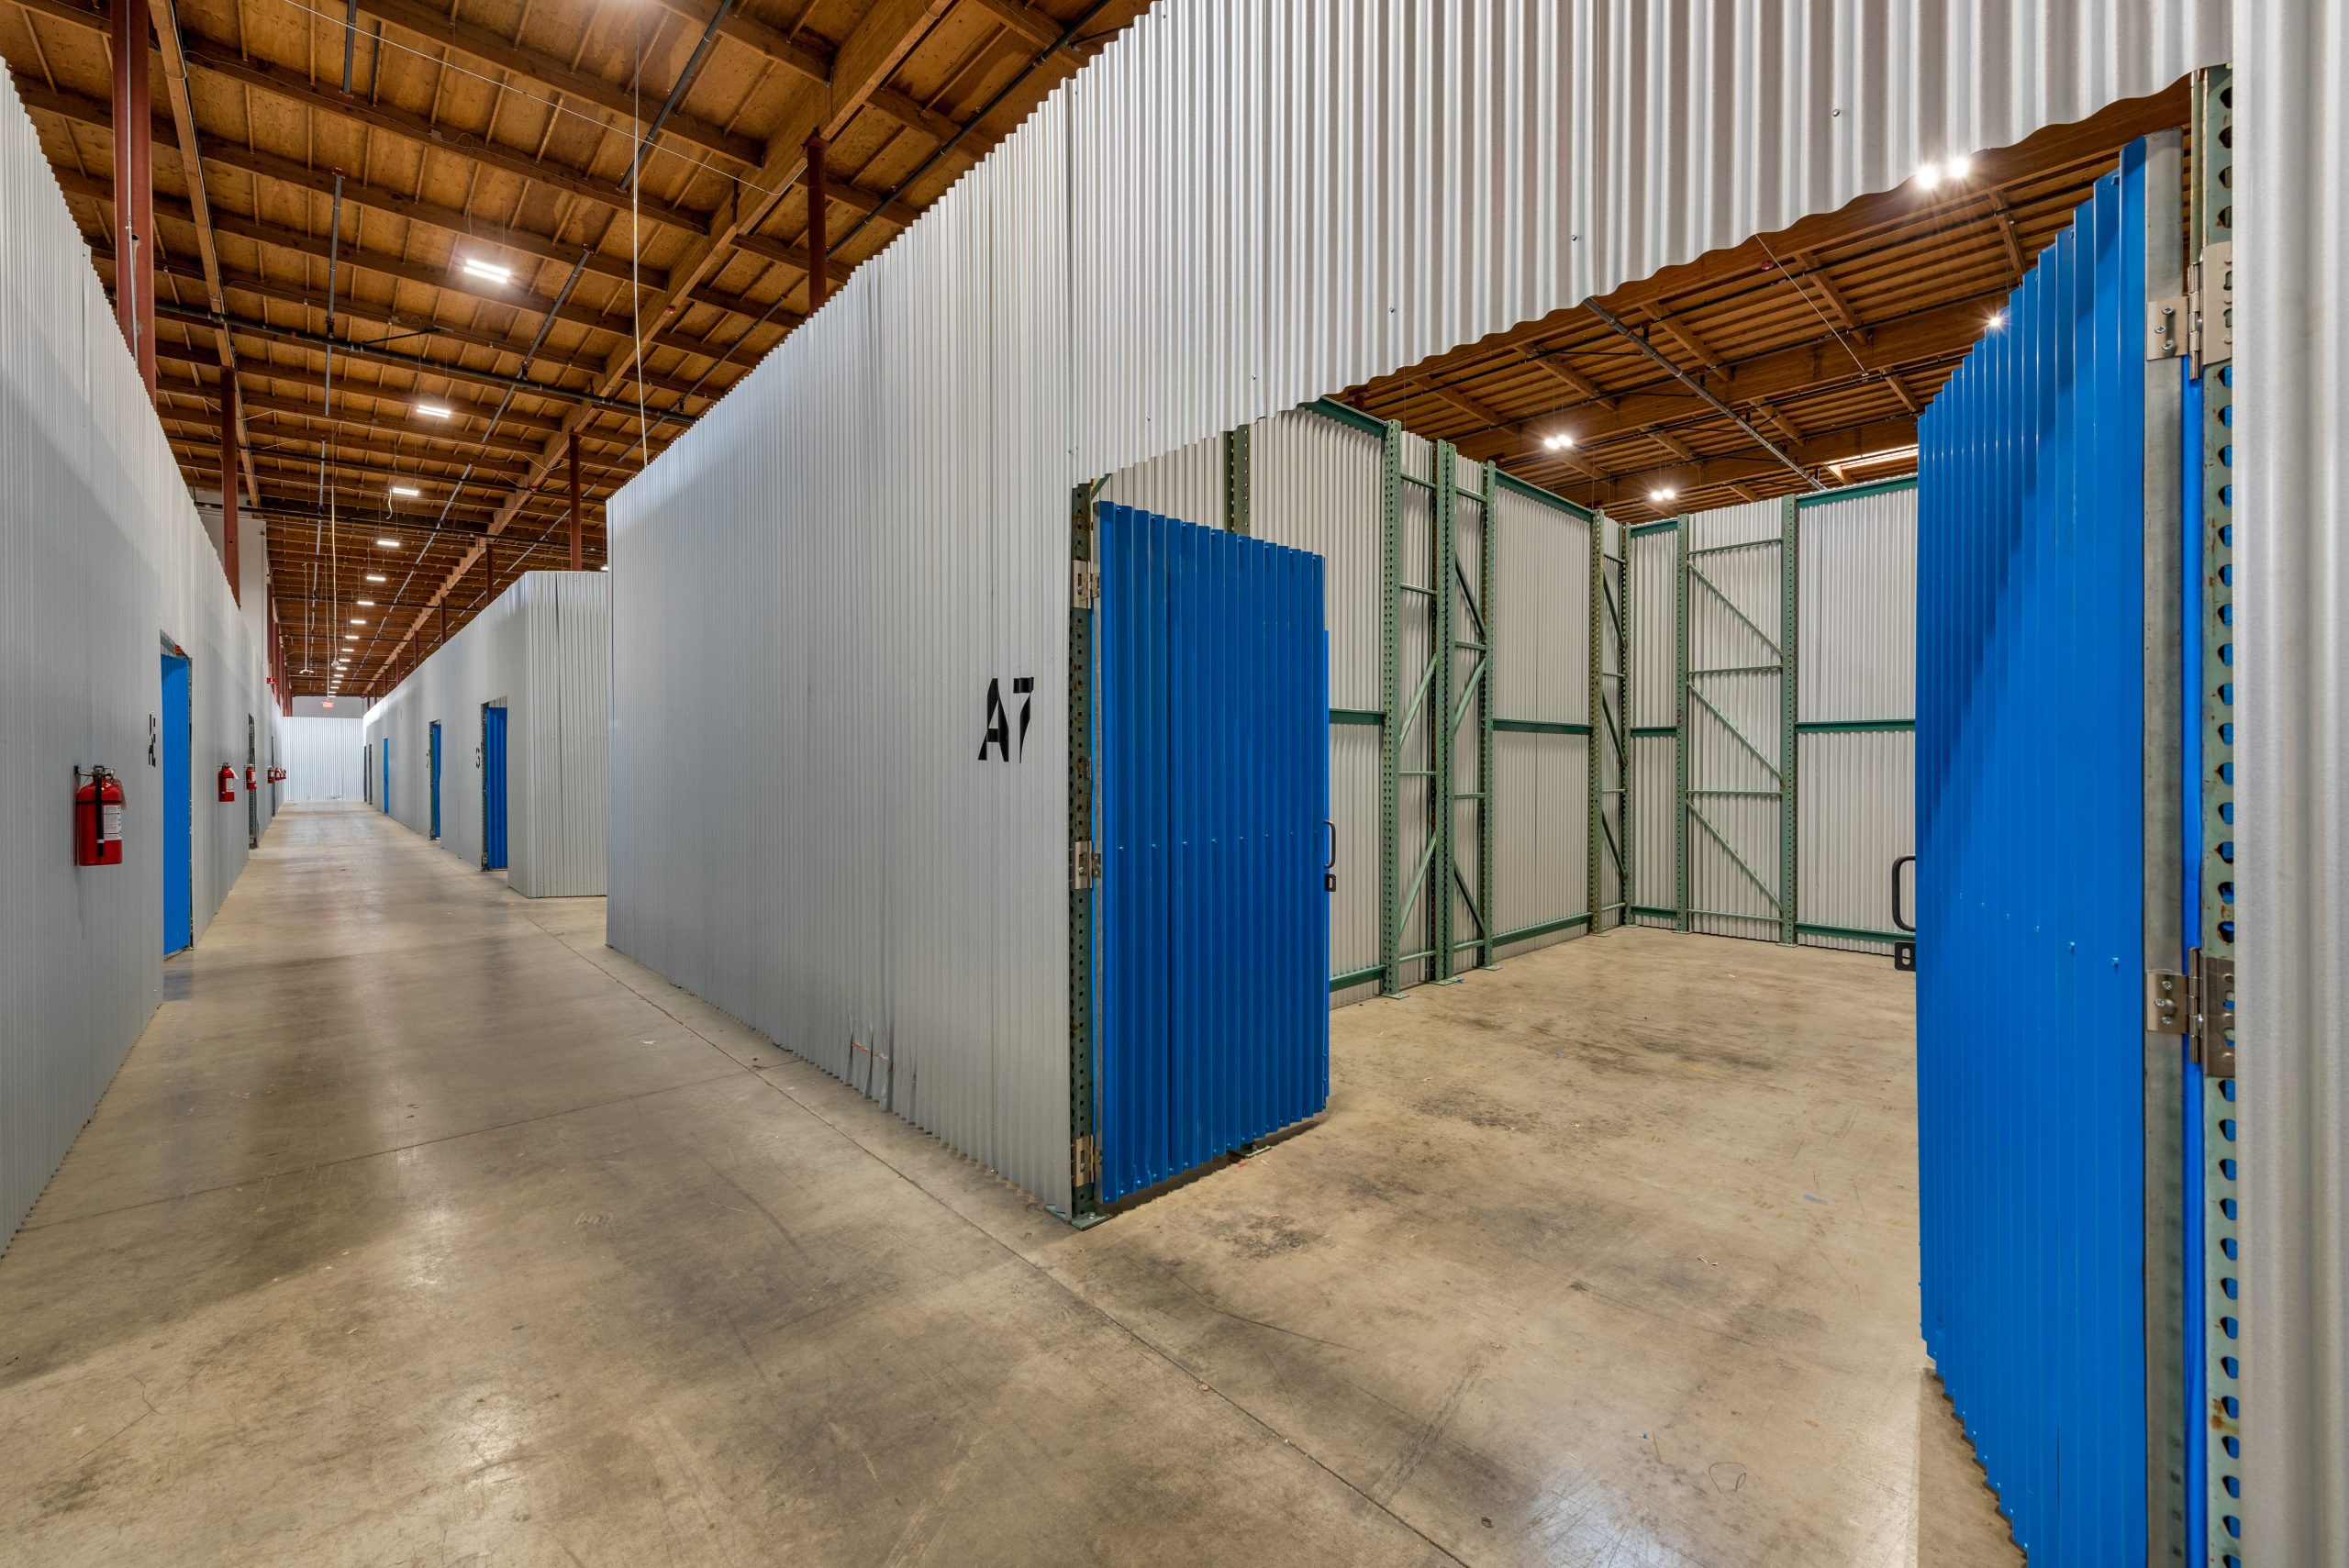
Co-Warehousing & Flexible Warehouse Space in Chicago
Small-bay and flex demand in Chicago holds steady beneath the big-box headlines, especially in infill submarkets where close-in space is scarce. A large, diverse small-business base and the metro’s role as a national rail crossroads support it. Office service/flex space averages $11.32/SF/yr in C&W’s data, compared with $7.16/SF/yr for warehouse/distribution.
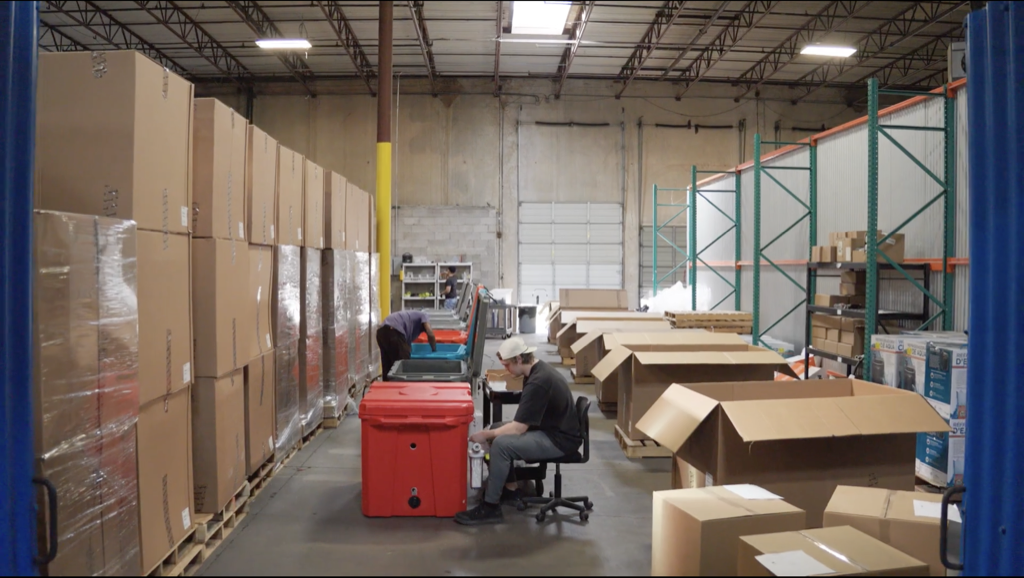
Chicago’s flex tenants tend to be last-mile and e-commerce operators, 3PLs tied to the intermodal rail network, and manufacturers and suppliers from the region’s industrial base. Contractors and Midwest food and beverage distributors fill out the list.
Browse available co-warehousing and small-bay warehouse listings on WareCRE’s Chicago marketplace.
Looking for warehouse space in Chicago?
Key Trends to Watch
1. Big-Box Leasing Picked Up in the First Half
Seven new leases of 500,000 SF or more were signed in the first half, compared with four a year earlier. The largest in Q2 were RJW Logistics (1,200,000 SF) at Karis Park West in Southern Fox Valley, KeHE Distributors (1,195,754 SF) and Hyundai Translead (906,517 SF) in the Interstate 80 Corridor, and a confidential 453,568 SF lease in the Interstate 55 Corridor. Read more: Small-Bay vs. Big-Box: What the Vacancy Gap Means in 2026.
2. Speculative Construction Is Growing Again
Speculative deliveries rose 270.2% year over year in the first half while build-to-suit deliveries fell 53.7%. Sixteen groundbreakings in Q2, up from five, and 7.2 million SF of speculative space under construction mean more competing big-box product ahead, concentrated in the Interstate 80 Corridor and Northwest Indiana.
3. Rent Growth Is Widespread but Uneven
The metro average rose only 0.9% year over year, although 15 of 20 submarkets posted gains and three moved sharply: Southern DuPage (up 58.5%), Western Kane County (up 23.1%) and the Interstate 80 Corridor (up 13.3%). Occupiers budgeting for renewals should look at their own submarket rather than the metro figure.
Outlook: What to Watch in Q4 2026
C&W’s Q3 2026 MarketBeats are due in mid-October, with the year-end release to follow. They will test three calls in C&W’s Q2 outlook.
Whether vacancy falls. C&W says that with leasing strengthening, “vacancy is expected to trend lower in the coming quarters.” Speculative deliveries in the Interstate 80 Corridor could slow that.
Absorption pace. Q2’s 3.3 million SF was up sharply from Q1. Absorption needs to hold near that level while new speculative space delivers to bring the 4.8% rate down.
Breadth of rent growth. C&W expects continued upward pressure on rental rates. After a 0.9% annual gain, watch whether the metro average starts to reflect the sharper submarket gains.
Find warehouse space in Chicago
Browse co-warehousing, small-bay, and distribution listings across Chicagoland.
Data sources: Cushman & Wakefield Chicago Industrial MarketBeat Q2 2026 (headline, submarket and product-type figures; rents net asking, $/SF/yr); Cushman & Wakefield U.S. Industrial MarketBeat Q2 2026 (restated Q1 2026 and Q2 2025 figures and U.S. averages; rents NNN); Matthews Chicago Industrial Market Report Q1 2026, citing CoStar data (cap rate and sale pricing only). Each report reflects the most recent vacancy, rental, and construction data available at the time of publication. We refresh our reports as new market data is released, and we’re continually expanding coverage to additional metros.
Related Resources
Frequently Asked Questions
What is the current industrial vacancy rate in Chicago?
Chicago industrial vacancy was 4.8% in Q2 2026, according to Cushman & Wakefield, unchanged for a third straight quarter and up 10 basis points year over year. The U.S. average in the same release was 6.9%. Submarket vacancy ranges from 0.8% in Southern DuPage to 7.9% in Southeast Wisconsin.
How much does warehouse space cost in Chicago?
The overall average asking rent was $7.55/SF/yr NNN in Q2 2026, up 0.9% year over year. Warehouse/distribution space averaged $7.16/SF/yr, manufacturing $7.58/SF/yr and office service/flex $11.32/SF/yr. Warehouse rents range from $5.36/SF/yr in the South Suburbs to $11.51/SF/yr in Southern DuPage.
Which Chicago submarket is best for warehouse space?
It depends on the requirement. The Interstate 80 Corridor has the most new supply and led the metro in absorption and leasing. The Interstate 55 Corridor is the established big-box alternative at 6.2% vacancy. O’Hare suits infill and airport-oriented users at 4.2% vacancy and $9.60/SF/yr. The South Suburbs offer the lowest warehouse rents at $5.36/SF/yr.
How much industrial space is under construction in Chicago?
C&W’s statistics table shows 13.9 million SF under construction at the end of Q2 2026, roughly double a year earlier. Its narrative puts speculative space at 7.2 million SF and build-to-suit at 6.3 million SF. First-half deliveries totaled 5.9 million SF.
What are industrial cap rates in Chicago?
Matthews, citing CoStar data, reported an average industrial cap rate of 8.1% in Q1 2026, with $1.1B of investment activity at an average of $100 per SF. Cushman & Wakefield’s Chicago MarketBeat does not publish a cap rate.