Dallas-Fort Worth Industrial & Warehouse Market Report | Q2 2026
Key Takeaways
- Dallas-Fort Worth industrial vacancy fell to 8.1% in Q2 2026, down 20 basis points from the prior quarter and 110 basis points year over year, as net absorption reached 9.0 million SF.
- Overall asking rents reached a new high of $9.19/SF/yr NNN, up 4.0% on the quarter and 13.2% on the year. DFW still asks about 11% less than the U.S. average of $10.32/SF/yr.
- Leasing totaled 20.5 million SF in Q2 and 40.3 million SF in the first half, which Cushman & Wakefield calls the strongest first half on record.
- 29.8 million SF is under construction, 2.9% of stock. Year-to-date deliveries of 13.6 million SF were matched by 13.6 million SF of net absorption.
Browse warehouse space for rent in Dallas-Fort Worth
8.1%
Overall Vacancy (Q2 2026)
$9.19
Avg. Asking Rent ($/SF/yr NNN)
9.0M
SF Net Absorption (Q2 2026)
29.8M
SF Under Construction
Dallas-Fort Worth added 9.0 million SF of net occupancy in Q2 2026, nearly double the 4.6 million SF recorded in Q1 as restated. Vacancy slipped to 8.1%, asking rents reached a new high, and first-half absorption matched new supply. Big-box vacancy is at its lowest since 2022, while mid-size buildings still in lease-up give tenants the most room to negotiate.
Figures are from Cushman & Wakefield’s Q2 2026 Dallas/Fort Worth Industrial MarketBeat unless noted. Prior-quarter and year-ago comparisons use the figures as restated in C&W’s Q2 2026 U.S. Industrial MarketBeat tables. Rents are net asking, quoted in $/SF/yr.
Market Snapshot: Q2 2026
| Metric | Q2 2026 | Q1 2026 (restated) | YoY or note |
|---|---|---|---|
| Overall vacancy | 8.1% | 8.3% | ↓110 bps YoY (9.2% in Q2 2025) |
| Overall asking rent ($/SF/yr NNN) | $9.19 | $8.84 | +13.2% YoY (from $8.11) |
| Warehouse/distribution asking rent ($/SF/yr) | $8.99 | n/a | W/D vacancy 9.1%, ↓140 bps YoY |
| Net absorption | 9.0M SF | 4.6M SF | 13.6M SF year to date |
| Leasing activity | 20.5M SF | n/a | +3.9% QoQ; 40.3M SF year to date |
| Deliveries | 13.6M SF year to date | n/a | Quarter-only figure not published |
| Under construction | 29.8M SF | n/a | 2.9% of stock |
| Inventory | 1.04B SF | n/a | Includes 858.8M SF of warehouse/distribution |
Source: Cushman & Wakefield, Dallas/Fort Worth Industrial MarketBeat Q2 2026. Q1 2026 and Q2 2025 values as restated in C&W’s U.S. Industrial MarketBeat Q2 2026 metro tables. n/a = not restated in the Q2 reports.
Rent Trends: A New High of $9.19/SF, Up 13.2% on the Year
Overall asking rents reached $9.19/SF/yr NNN in Q2 2026, a new high for the metro, up 4.0% on the quarter and 13.2% on the year. Warehouse/distribution space, which makes up most of DFW’s inventory, asks $8.99/SF/yr. C&W attributes part of the jump to mix, since fewer big-box vacancies, which quote the lowest rates, pushed the weighted average up. It also reports that both asking and contract rents rose where competing vacancy is near or below the long-term average.
DFW remains a value market by national standards. The U.S. overall average in the same C&W release is $10.32/SF/yr NNN, so DFW asks about 11% less. Among the four large submarkets profiled below, warehouse rents run from $6.69/SF/yr in South Dallas to $11.06/SF/yr around DFW Airport.
For Tenants
Leverage now depends on building size. C&W reports that vacancy in buildings over 500,000 SF has tightened to its lowest level since 2022. Mid-size buildings of 150,000 to 499,999 SF are the only size segment still above 10.0% vacancy, because recent deliveries are still leasing up. Concessions remain favorable, but C&W advises that tenants targeting tight size ranges or submarkets “should not delay decisions as pricing power is returning to landlords.” Search Dallas-Fort Worth warehouse listings on WareCRE.
Construction Pipeline: 29.8M SF Underway, Supply and Demand in Balance
DFW had 29.8 million SF under construction at the end of Q2 2026, 2.9% of stock. Build-to-suit projects account for 11.6 million SF, or 38.8%, and speculative construction for 18.2 million SF. Site work was underway on another 16.9 million SF.
First-half deliveries of 13.6 million SF were matched by 13.6 million SF of net absorption, so vacancy edged down. The largest pipelines are in Alliance (7.7 million SF), South Fort Worth (3.5 million SF) and DFW Airport (3.1 million SF).
For Operators
Pricing power is moving toward owners. C&W says landlords may be shifting from “price taker” to “price maker” where competing vacancy is near or below the long-term average, with annual escalations typically at 3.75%–4.00%. Mid-size owners carry the most exposure, as that size band is the only one above 10.0% vacancy. C&W also says conditions are ripe for new speculative starts of 500,000 SF and larger, so today’s big-box scarcity may not last.
Submarket Breakdown: Alliance Leads on Absorption and Construction
C&W splits DFW into Dallas-side submarkets (8.1% vacancy) and Fort Worth-side submarkets (8.0%). The four below are the largest or most active by Q2 2026 absorption and construction.
Great Southwest
The metro’s largest submarket at 129.8 million SF, centered on Grand Prairie and Arlington between Dallas and Fort Worth. Vacancy is 7.6% and warehouse space asks $9.15/SF/yr. It absorbed 1.2 million SF in Q2 but only 142,078 SF year to date, and has 2.0 million SF under construction.
DFW Airport
A 110.0 million SF infill and air-cargo submarket with the highest warehouse rent of the four profiled here, $11.06/SF/yr. Vacancy is 11.2%, also the highest of the four, with 3.1 million SF under construction. Amazon’s 1,075,544 SF lease at Passport Park West and Flexport’s 799,460 SF lease at Majestic Airport Center were two of the quarter’s largest deals.
South Dallas
101.0 million SF of big-box distribution along I-20 and I-45. Vacancy is 9.2%, against a 10-year average of 15.5%. C&W has it on pace for 6.4% by year-end 2026, which would be the lowest since 2007. It absorbed 1.3 million SF in Q2 and 2.0 million SF year to date, helped by DHL’s 586,889 SF lease at ALTO Pinto 45. Warehouse rents are the lowest of the four at $6.69/SF/yr.
Alliance
North Fort Worth’s rail-served logistics hub, anchored by the Alliance development and BNSF intermodal facility. At 87.4 million SF and 7.9% vacancy, it led the metro in net absorption with 2.7 million SF in Q2 and 3.9 million SF year to date. It also carries the largest pipeline at 7.7 million SF. Celestica’s 1,009,280 SF lease at Alliance Center North was one of the quarter’s top deals. Warehouse rents average $9.34/SF/yr.
| Submarket | Vacancy | W/D Asking Rent ($/SF/yr) | YTD Net Absorption (SF) | Under Construction (SF) |
|---|---|---|---|---|
| Great Southwest | 7.6% | $9.15 | 142,078 | 1,966,711 |
| DFW Airport | 11.2% | $11.06 | 350,875 | 3,103,143 |
| South Dallas | 9.2% | $6.69 | 2,012,660 | 2,284,000 |
| Alliance | 7.9% | $9.34 | 3,899,391 | 7,657,916 |
| East Dallas Suburbs | 7.9% | $7.75 | 2,392,179 | 1,442,721 |
| South Fort Worth | 9.3% | $7.34 | 1,818,861 | 3,464,977 |
| Dallas total | 8.1% | $9.16 | 7,417,390 | 15,468,962 |
| Fort Worth total | 8.0% | $8.47 | 6,209,247 | 14,362,187 |
Source: Cushman & Wakefield, Dallas/Fort Worth Industrial MarketBeat Q2 2026, market statistics table.
Co-Warehousing & Flexible Warehouse Space in Dallas-Fort Worth
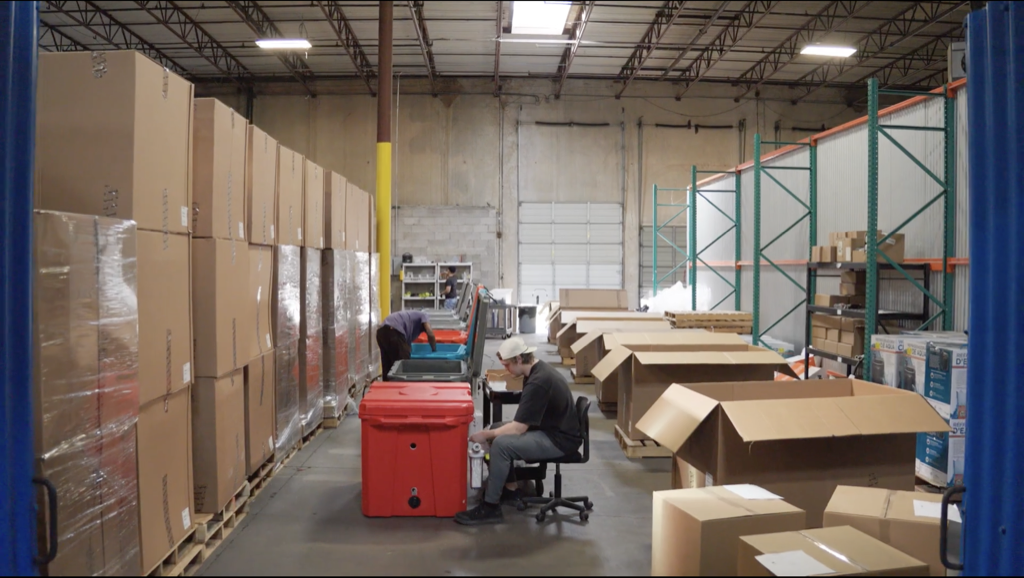
Bulk logistics drives DFW’s headline numbers, but the metro’s large small-business economy keeps small-bay and flex space in steady demand from firms that need operating space without a million-SF commitment. In C&W’s product breakdown, office service/flex space is 6.2% vacant across 82.0 million SF and asks $12.90/SF/yr, tighter than the 9.1% warehouse/distribution rate.
DFW’s flexible-space tenants are mostly e-commerce sellers using the metro’s central U.S. reach and 3PLs that need overflow capacity. Building trades, food and beverage distributors serving Texas, and companies relocating to the metro make up much of the rest.
Browse available co-warehousing and small-bay warehouse listings on WareCRE’s Dallas-Fort Worth marketplace.
Looking for warehouse space in Dallas-Fort Worth?
Key Trends to Watch
1. Leasing Is at a Record Pace, and It Is Broad-Based
C&W counts 72.1 million SF of new commitments over the past 12 months, an all-time high above the previous record set in 2021. Requirements came from 3PL, manufacturing, eCommerce and data center-related suppliers. Large users did much of the lifting, with 28 users over 500,000 SF leasing 23.0 million SF over the same period, 31.9% of newly leased space.
2. Big-Box Vacancy Is at Its Lowest Since 2022; Mid-Size Holds the Slack
Vacancy in buildings over 500,000 SF has fallen to its lowest level since 2022, and warehouse/distribution vacancy is down 140 bps on the year to 9.1%. The slack sits in mid-size buildings of 150,000 to 499,999 SF, still above 10.0% vacancy. Tenants should price the two segments separately. Read more: Small-Bay vs. Big-Box: What the Vacancy Gap Means in 2026.
3. Absorption Has Caught Up With Supply
First-half absorption and deliveries were both 13.6 million SF. C&W projects about 32.9 million SF of completions for full-year 2026 against net absorption of 33.7 million SF or higher, based on known move-ins and move-outs. If that holds, demand would edge slightly ahead of new supply for the full year, which C&W expects to keep vacancy falling.
Outlook: What to Watch in Q4 2026
C&W’s Q3 2026 MarketBeats are due in mid-October, with the year-end release to follow. Three items will show whether DFW’s second half tracks C&W’s own projections.
Pre-committed demand. C&W says DFW entered Q3 with 20.0 million SF of net absorption lined up from known move-ins and move-outs, enough to lift 2026 absorption to 33.7 million SF. Watch Q3 absorption against that pace.
Year-end vacancy. C&W expects vacancy to fall to 7.9% or lower by year-end, 90 bps above the 10-year average. A Q3 reading at or below 8.0% would keep that target on track.
Rent growth. Part of the 13.2% annual gain reflects fewer low-priced big-box vacancies in the average. Watch speculative big-box starts, which C&W says conditions now favor. More of them could reverse that mix effect.
Find warehouse space in Dallas-Fort Worth
Browse co-warehousing, small-bay, and distribution listings across the DFW Metroplex.
Data sources: Cushman & Wakefield Dallas/Fort Worth Industrial MarketBeat Q2 2026 (headline, submarket and product-type figures; rents net asking, $/SF/yr); Cushman & Wakefield U.S. Industrial MarketBeat Q2 2026 (restated Q1 2026 and Q2 2025 figures and U.S. averages; rents NNN); Matthews Dallas-Fort Worth Industrial Market Report Q1 2026, citing CoStar data (cap rate and sale pricing only). Each report reflects the most recent vacancy, rental, and construction data available at the time of publication. We refresh our reports as new market data is released, and we’re continually expanding coverage to additional metros.
Related Resources
Frequently Asked Questions
What is the current industrial vacancy rate in Dallas-Fort Worth?
DFW industrial vacancy was 8.1% in Q2 2026, according to Cushman & Wakefield, down 20 basis points from Q1 and 110 basis points from a year earlier. Dallas-side submarkets averaged 8.1% and Fort Worth-side submarkets 8.0%. Warehouse/distribution vacancy was 9.1%.
How much does warehouse space cost in Dallas-Fort Worth?
The overall average asking rent was $9.19/SF/yr NNN in Q2 2026, up 13.2% year over year. Warehouse/distribution space averaged $8.99/SF/yr and office service/flex space $12.90/SF/yr. Among the largest submarkets, warehouse rents run from $6.69/SF/yr in South Dallas to $11.06/SF/yr near DFW Airport.
Which DFW submarket is best for warehouse space?
It depends on the requirement. Alliance led the metro in net absorption and has the largest pipeline at 7.7 million SF. South Dallas has the lowest warehouse rents of the large big-box submarkets at $6.69/SF/yr. DFW Airport suits infill and air-cargo users but asks $11.06/SF/yr. Great Southwest, the largest submarket at 129.8 million SF, sits between Dallas and Fort Worth at 7.6% vacancy.
How much industrial space is under construction in Dallas-Fort Worth?
29.8 million SF was under construction at the end of Q2 2026, 2.9% of stock, with 11.6 million SF build-to-suit and 18.2 million SF speculative. Year-to-date deliveries totaled 13.6 million SF, matched by 13.6 million SF of net absorption.
What are industrial cap rates in Dallas-Fort Worth?
Matthews, citing CoStar data, reported an average industrial cap rate of 6.2% in Q1 2026, on $369M of sales volume at an average of $147 per SF. Cushman & Wakefield’s MarketBeat does not publish a DFW cap rate.